
A year ago, Redis Inc (formerly Garantia Data) made a controversial move that disrupted the open source ecosystem: it closed the source of Redis. As I wrote at the time, it was a trust-breaking decision that could have shattered the community.
But instead of splintering, the community responded with purpose. Out of that disruption came Valkey, a fork that took a shot at keeping the community alive.
A Return, A Reversal
As part of efforts to rebuild trust with the community, Redis Inc brought back Salvatore Sanfilippo (aka Antirez), the original creator of Redis. I am genuinely excited about his return because it is already impactful. He’s following through on his promise of contributing new features and performance optimizations to Redis. More profoundly, Redis 8.0 has been open-sourced again.
Redis acknowledged that adopting SSPL strained their bond with the community, questioning contributions from others in the same breath: “How do you keep innovating and investing in OSS projects when cloud providers reap the profits and control the infrastructure without proportional contributions back to the projects that they exploit?”
The disheartening move from Redis Inc catalyzed an unprecedented wave of collaboration and contributions. Valkey became the test of the community resolve to keep itself together. One year later, Valkey hasn’t just survived – it’s thriving! The Async I/O Threading model contribution from AWS unlocked 3x+ throughput by fundamentally changing how I/O threads work inside Redis.
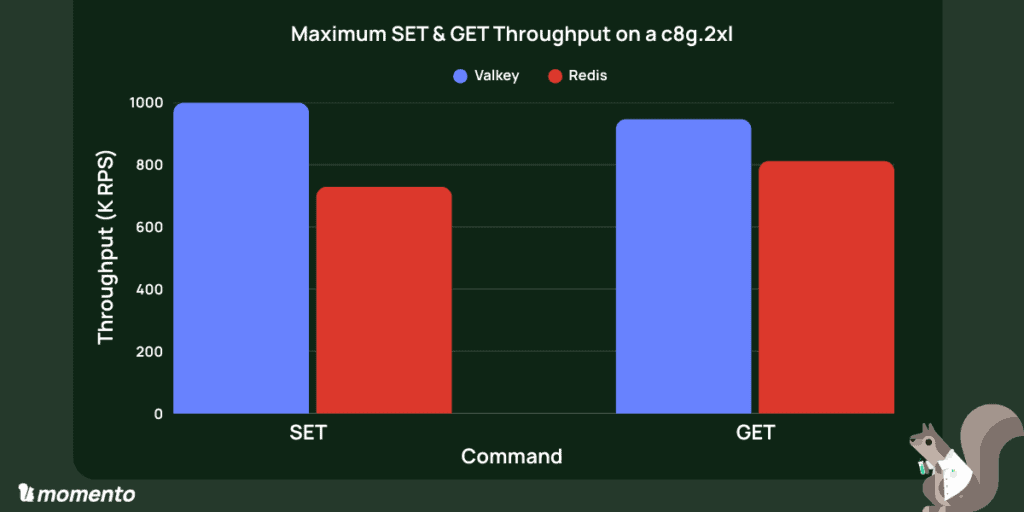
But how do these and other contributions compare to Redis 8? Can we hit 1M RPS out of an 8 VCPU instance (c8g.2xl) on either Valkey 8.1 or Redis 8.0 (with 1KB items, 3M items in the key space, and ~500 connections)? It’s time for a bake off!
Valkey 8.1 vs Redis 8.0: Can the Fork Outrun the Source?
The punchline: we could not sustain 1M RPS on an 8 VCPU instance with either Valkey or Redis 8.0, but we got really close!!
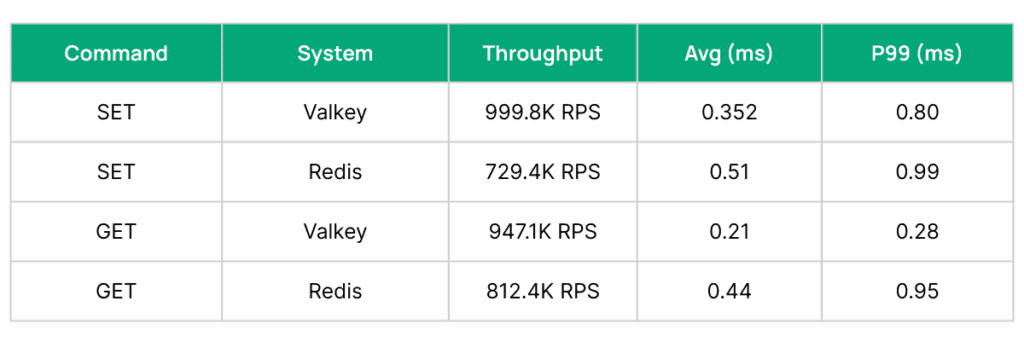
On a full-tuned c8g.2xl (8 VCPU), Valkey 8.1.1 pushed to 999.8K RPS on SETs with .8ms p99 latency. Redis 8.0 got as high as 729.4 RPS on SETs with .99ms p99 latencies. On each iteration, we tested 50M SETs followed by 50M GETs. We varied connection counts to optimize the maximum throughput for each system.
Valkey achieved higher throughput and lower latency across both reads and writes (37% higher on SET and 16% higher on GET), alongside 30% faster p99 latencies for SET and 60%+ faster on GET.
Threading the multi-threading needle
If I had a penny for every time heard, “but Redis /Valkey is single threaded….”
Antirez’s emphasis on a shared nothing architecture has been foundational for Redis. Nevertheless, as early as 2020, Redis added support for I/O threads. Unfortunately, they did not offer drastic improvement until recently. If you have previously tried and discarded I/O threads, it is time to evaluate again!
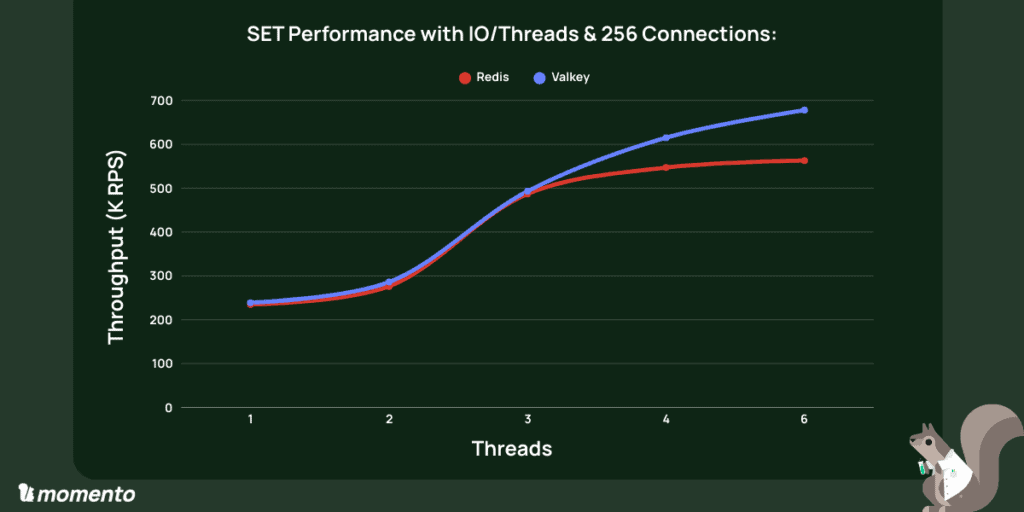
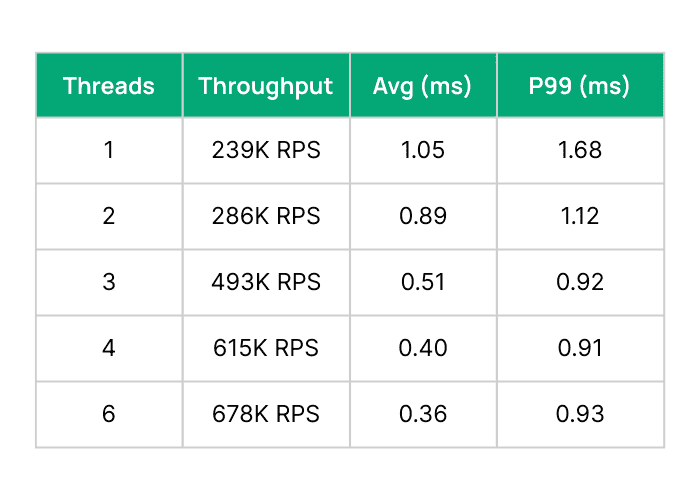
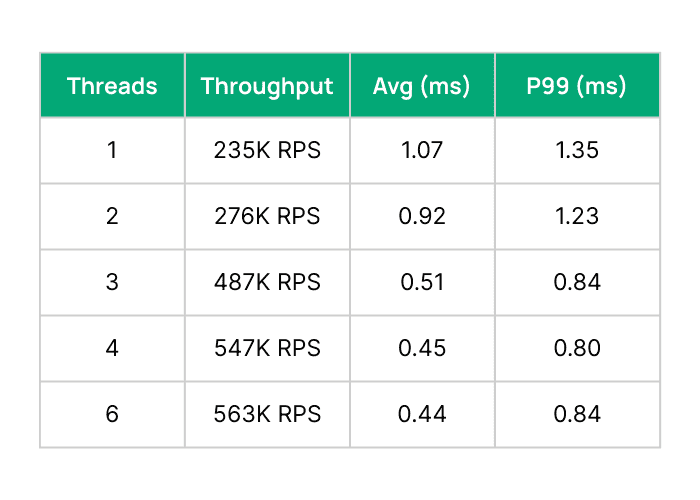
On Valkey, we see SET throughput going from 239K RPS without I/O threads to 678K with 6 threads. Meanwhile, p99 latencies dropped from 1.68ms to 0.93ms despite doing nearly 3x the throughput! Similarly, Redis went from 235K RPS without I/O threads to 563K RPS with 6 I/O threads. P99s for Redis also dropped around 40% from 1.35ms to 0.84ms.
Two key takeaways emerged:
- With two threads, gains were modest (~20%). The impact only really surfaced at three threads and beyond.
- Redis and Valkey were neck-and-neck until the fourth thread. After that, Valkey pulled away sharply.
SET Performance on Valkey with IO/Threads & 256 Connections:
SET Performance on Redis with IO/Threads & 256 Connections:
Pushing Valkey Throughput Further
In the previous section, we saw that Valkey could hit 678K RPS on SETs with 6 threads and 256 connections. If we up the connections to 400, the throughput goes up to 832K RPS. How did we get the additional 167K RPS?
We used Rezolus, our favorite Linux performance telemetry agent, to get deep insights into the system under stress. You can see in the charts below that overall CPU utilization is around 80% and unevenly distributed across the 8 cores.
Diving deeper, this is driven by hardware interrupts from network queues across all 8 cores. Interrupts are bad because they disrupt a hard working Valkey thread to yield to handle network packets.
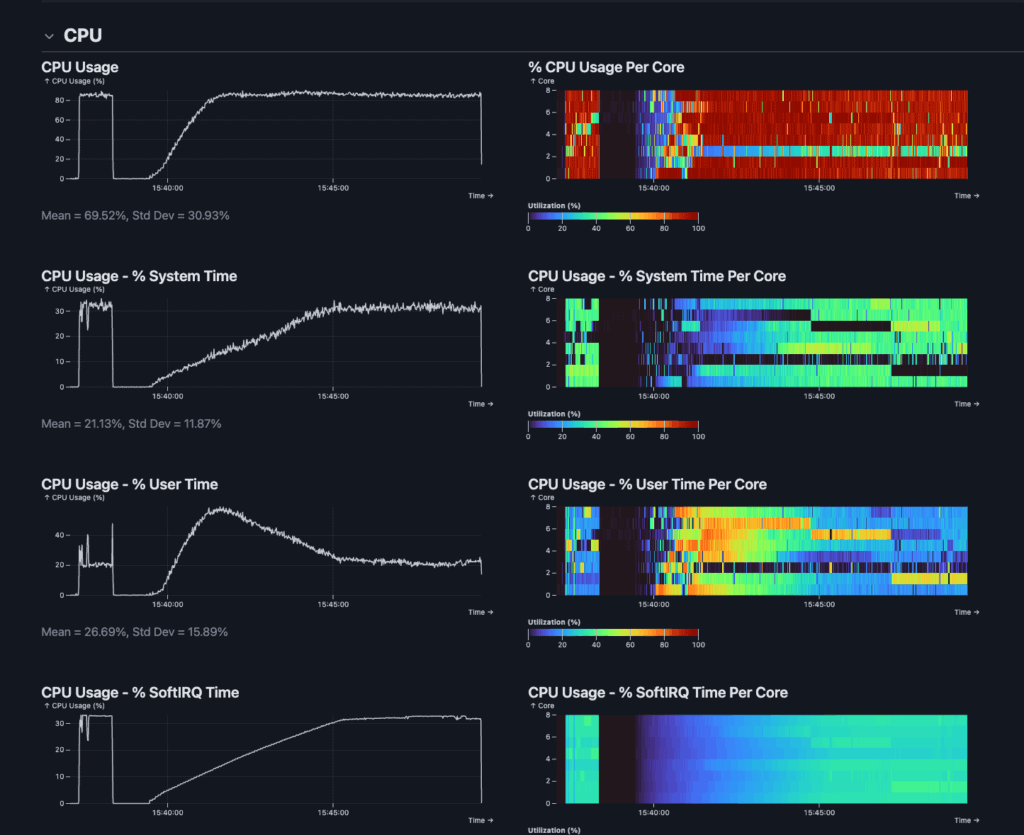
What if we could avoid the context switching on our c8g.2xl with 8 cores? Running close to a million RPS requires considerable packet processing horsepower. Luckily, since a lot of work happens at the Nitro level on EC2 instances, two allocated cores to IRQs is all you need (if you let them focus). Pinning the IRQs to two cores is pretty straightforward.
sudo ethtool -L ens34 combined 2 # reduce to 2 IRQs
grep ens34 /proc/interrupts # ours were on 99 and 100
echo 1 | sudo tee /proc/irq/99/smp_affinity # pin 99 to core 1
echo 2 | sudo tee /proc/irq/100/smp_affinity # pin 100 to core 2
But how do we let these threads focus? and how do we avoid Redis / Valkey threads contending for the same cores? We pin Redis/Valkey to cores 3-8, giving their IO-Threads better isolation while also allowing the IRQs to focus. We used the --cpuset-cpus Docker flag to set these CPU assignments, making sure that Redis and Valkey process stayed pinned to the intended cores throughout the test. This reduces cross-core contention and improves cache locality, both of which are critical for minimizing tail latencies at high throughput. Ideal core allocation can vary in multi-tenant environments or mixed workloads, but in this benchmark it provided clean isolation between system and application workloads.
Redis:
docker run --network="host" --rm \
  --cpuset-cpus="2-7" redis:8.0 \
  --save "" --appendonly no \
  --io-threads 6  \
  --protected-mode no --maxmemory 10gb
Valkey:
docker run --network="host" --rm \
  --cpuset-cpus="2-7" valkey/valkey:8.1.1 \
  --save "" --appendonly no --io-threads 6 \
  --protected-mode no --maxmemory 10gb
Let’s see what Rezolus has to say about the new setup with IRQs pinned to the first 2 cores and Valkey pinned to the remaining 6 cores. First, we observed meaningfully higher CPU Utilization. Second, looking at the bottom chart (SoftIRQ), we see that it is now limited to only the first two cores. Third, the Valkey cores are running red hot, whereas we previously saw a much more scattered distribution one usage across cores. While this setup is ideal for this benchmark, optimal IRQ tuning depends heavily on NIC architecture and the concurrency model of your application.
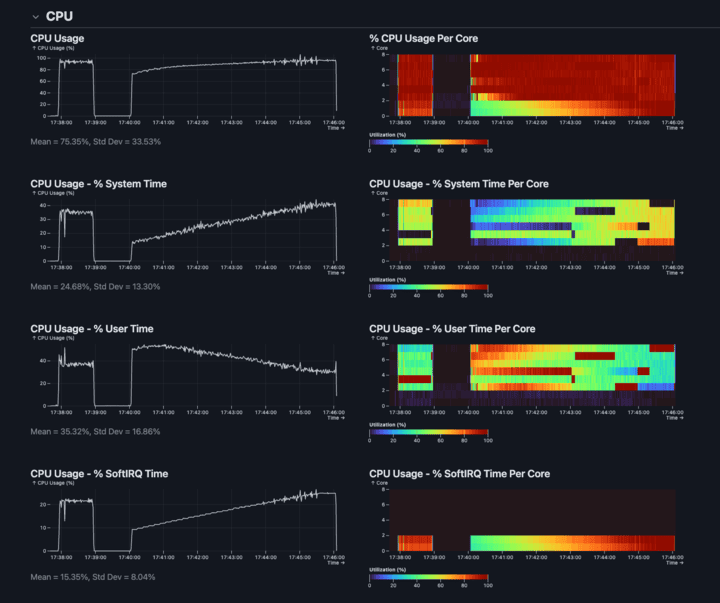
The extra 20% CPU utilization is what buys us the extra 167K RPS (from 832K RPS to 999.8K RPS).
Try it Yourself (And Know Before You Go)
These benchmarks are hopefully a beginning and not the end. Our hope is that this sets up both Valkey and Redis communities to continue the performance improvement journey. We also recognize that many folks may want to reproduce the benchmark in their own environments, incorporating their workflow specifics. Below, we outline some key instructions that you can use to reproduce this in your own AWS account within an hour.
Instance Types: We used AWS Graviton4-based c8g instances, launched in September 2024. The c8g.2xlarge server node provides 8 vCPUs (costing roughly $250/month in us-east-1), while the c8g.8xlarge load generator offers 32 vCPUs. This provided enough CPU headroom to cleanly isolate the benchmark workload, IRQ handling, and Redis/Valkey processing. The same c8g.2xl instance was used to run valkey and redis (one at a time). The same load gen node was run each time. Valkey and Redis were restarted right before each test to ensure fairness.
Placement Groups: We used EC2 placement groups (cluster mode) to ensure minimal network jitter and low-latency communication between the client and server nodes. Placement groups offer extremely tight latencies by reducing the number of hops between your EC2 instances. This has the upside on higher throughput, fewer interruptions, and lower latencies – but it has some shared fate / blast radius implications that are worth considering before deploying them in your production environment.
Core Pinning. To see the highest throughput and lowest latencies, consider core pinning and reducing the IRQs. See section above for specific instructions we used on our 8 core instance. It is also important to apply similar techniques on your test nodes.
Vary the connections. Connection count is a surprisingly crucial variable for both Redis and Valkey. In fact, latencies rise steeply as you approach 1024 connections on both of them. For example, going from 400 to 1024 connections, Valkey’s SET throughput dropped from 999.9K RPS with to 969K RPS and p99 latencies doubled from .8ms to 1.6ms (at 2048 conns, p99 latencies triple). Going from 384 connections to 1024, Redis throughput drops from 729.4K RPS to 668K RPS, and p99 latencies more than double from .99ms to 2.5ms. Lower throughput with higher latencies? You get why connection count tuning is so crucial here.
Key Space. If you want the best numbers, use smaller values and a really small key space (-r 10000). This will help you get everything from L3 cache. To make this test slightly more real world, we used 1KB items (-d 1024) and a key space of 3Million (-r 3000000).
Multi-Thread the Benchmark App. To get the maximum throughput out of valkey-benchmark, make sure to turn on multi-threading on the benchmark tool as well. The --threads 6 flag tells valkey-benchmark to run in multi-threaded mode.
Benchmark command:
docker run --network="host" --rm --cpuset-cpus="2-7" \
valkey/valkey:8.0.1 valkey-benchmark \
-h 172.31.4.92 -p 6379 -t SET,GET -n 100000000 -c 256 \
-r 3000000 --threads 6 -d 1024
A Final Caveat: Benchmarking is imprecise in nature
We made every effort to make this benchmark resemble more real world workflows, but you can always do better. Valkey-bench is not perfect (nothing is). We have a wishlist of improvements (and so does the Valkey project).
First, today, it simply pushes as much load as the server is able to handle instead of targeting a particular TPS. The real world rarely modulates its throughput based on your latency. Second, once it can target specific load, it would become closer to real world if it could modulate the load to show spikes and troughs as opposed to running a consistent throughput profile. Lastly, it’s rare to see 100% GETs or 100% SETs in a Key Value cache workflow. We’d love to provide a SET:GET ratio to see how the system reacts.
At Momento, we typically do our testing using rpc-perf. It is written entirely in rust, handles more real world scenarios (like the three feature requests above), and pairs incredibly well with Rezolus. Regardless, even rpc-perf is a synthetic benchmark and even though it gives you more degrees of freedom to simulate production workflows, the results should not be interpreted as generally applicable to every workflow. Small variables make huge differences – and simulations are no match for production.
Final Thoughts: Performance Is a Practice
Valkey has not only kept pace – it’s setting it. Meanwhile, the performance ceiling keeps rising. But getting there isn’t automatic. It requires expertise across systems, infrastructure, and workload behavior.
At Momento, we help teams achieve this kind of performance every day. Whether you’re running Valkey, Redis, or evaluating your options – we’re here to help you scale with confidence.
Want help tuning your real-time infrastructure? Let’s talk.
.prism-copy { position: relative; right: -55em; } @media (max-width: 600px) { .prism-copy { position: relative; right: 0px; }
Special thanks to Yao and Brian from IOP Systems for providing the tools, including rpc-perf and rezolus, as well as insights for this benchmark.