
A cache client should feel at home on a developer’s laptop and in a production environment. Those two settings have different network conditions, though, and one configuration cannot optimize every workload automatically.
In this 2022 experiment, we tuned the Momento JavaScript client by changing two controls: the number of gRPC channels and the maximum number of requests in flight. The tests showed that extra channels helped only when each channel used a local subchannel pool. They also showed that limiting concurrency could trade some throughput for much lower tail latency.
This post is part of our series on the work behind a simple developer experience. The first post explains why the client should own this tuning. This one shows the measurements that informed our original Node.js defaults.
Historical benchmark: These measurements and API names describe the client and service as they existed in 2022. The benchmark is not a current SDK comparison or a reproducible test plan: it does not record the SDK, Node.js, or gRPC versions; request and value shapes; run duration; repetitions; or complete laptop specifications. Use the current JavaScript configuration guide for implementation decisions today.
What the client needed to balance
The JavaScript client uses gRPC for remote procedure calls. gRPC runs over HTTP/2, which can multiplex requests on one connection, and uses Protocol Buffers for its binary wire format. The client hides those details in normal use, but its gRPC configuration determines how much work can move through each connection.
Node.js adds another constraint. Its default execution model runs JavaScript callbacks on one event-loop thread. Applications can use worker threads or multiple processes, but a general-purpose SDK cannot assume a particular scaling strategy. We therefore focused this test on one Node.js process and tried to keep as much CPU time as possible available for application callbacks.
That led to three tuning questions:
- Can the JavaScript path do less CPU work?
- Can gRPC delegate more work to the underlying I/O layer?
- How many requests should the client allow in flight before event-loop contention overwhelms any throughput gain?
The first question involved ordinary JavaScript optimization, so this post focuses on channels and concurrency.
Start where developers start: a laptop
A laptop usually sits farther from the service than an in-region production host, so its network latency is higher. It is also where many developers first put a client through an intentionally unrealistic stress test: launch asynchronous gets and sets in a loop and see how fast they run.
We did exactly that. The test varied the number of concurrent request loops from 10 to 10,000. This is not a recommended production workload; it is a way to expose what happens when the event loop and connection capacity are saturated.
Why thousands of requests inflate client latency
The SDK does little computation beyond encryption and serialization, but 5,000 concurrent loops still put a large callback queue on one event-loop thread. A response can already be back from the service while its callback waits for CPU time. Client-side latency then includes that wait and can look much worse than the server-side measurement.
At the time of this test, the service allowed 100 concurrent HTTP/2 streams on a connection. The client used one gRPC channel, so 4,900 of 5,000 concurrent requests could be waiting for connection capacity. In the laptop test, that configuration produced p50 client-side latency above 2 seconds.
More channels needed local subchannel pools
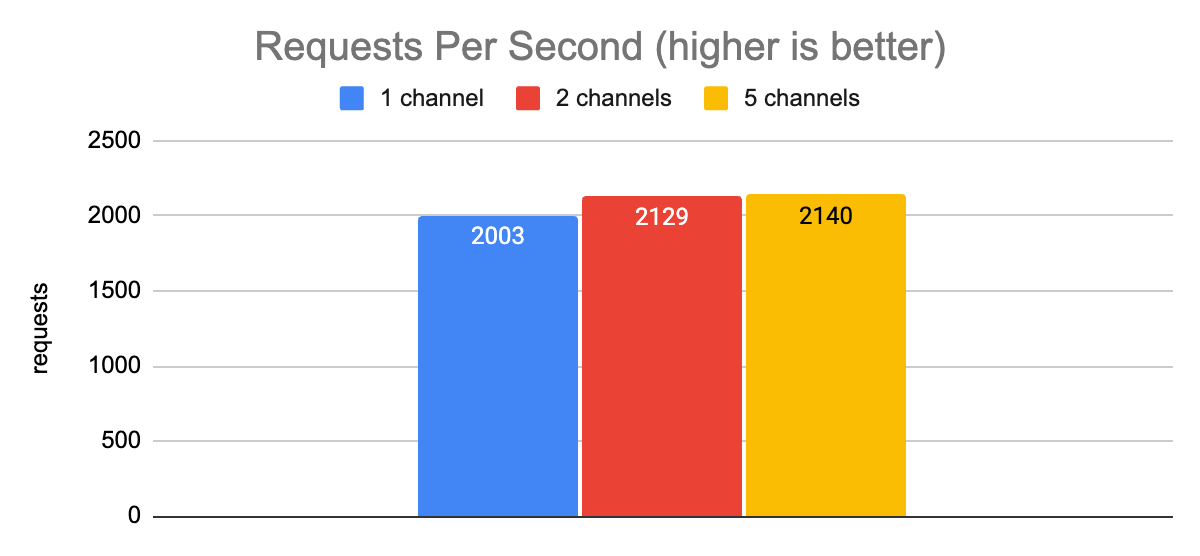
Our first channel-count sweep barely changed either metric.
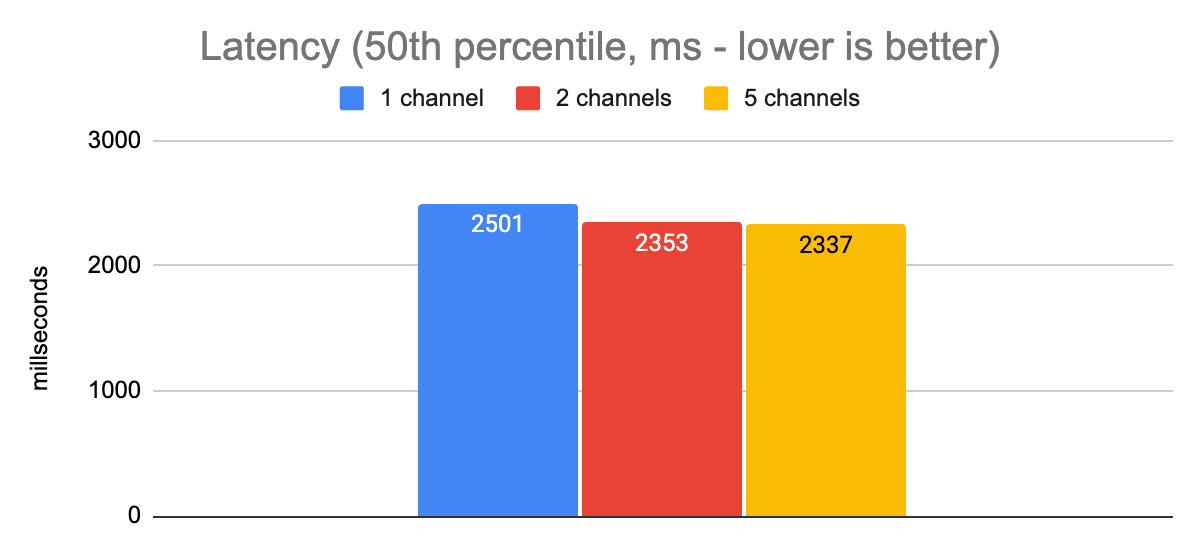
Laptop p50 latency before local subchannel pools (ms)
| Channels | 1 | 2 | 5 |
|---|---|---|---|
| p50 latency | 2,501 | 2,353 | 2,337 |
Lower latency is better. The article does not record the margin of error.
Laptop throughput before local subchannel pools (requests/s)
| Channels | 1 | 2 | 5 |
|---|---|---|---|
| Throughput | 2,003 | 2,129 | 2,140 |
Higher throughput is better.
The missing piece was the grpc.use_local_subchannel_pool setting in the Node.js grpc-js library. Without it, the channels used a global subchannel pool. Enabling a local pool for each channel produced a very different result.
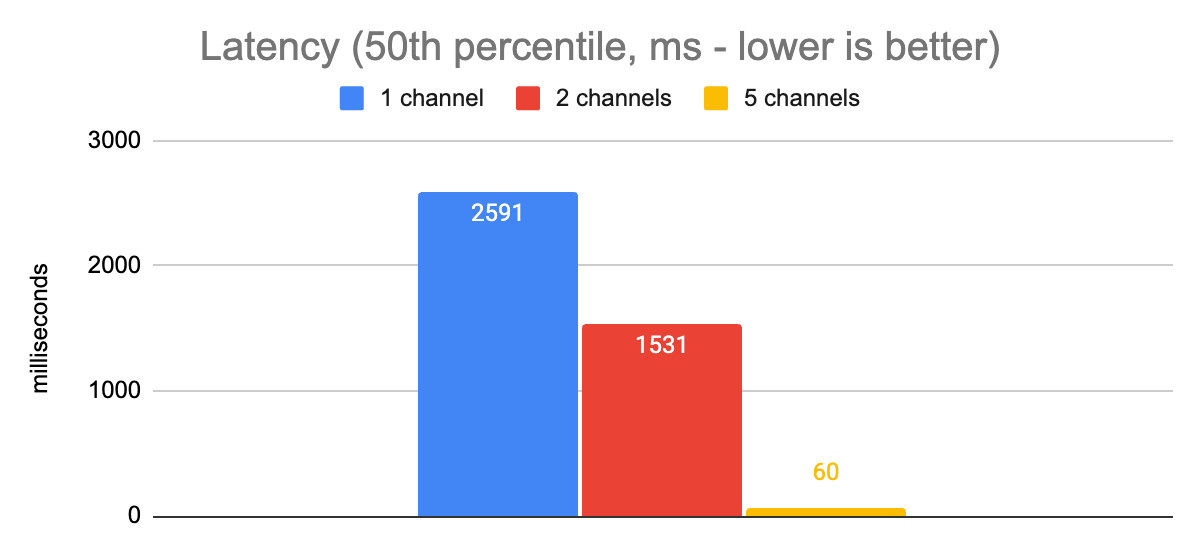
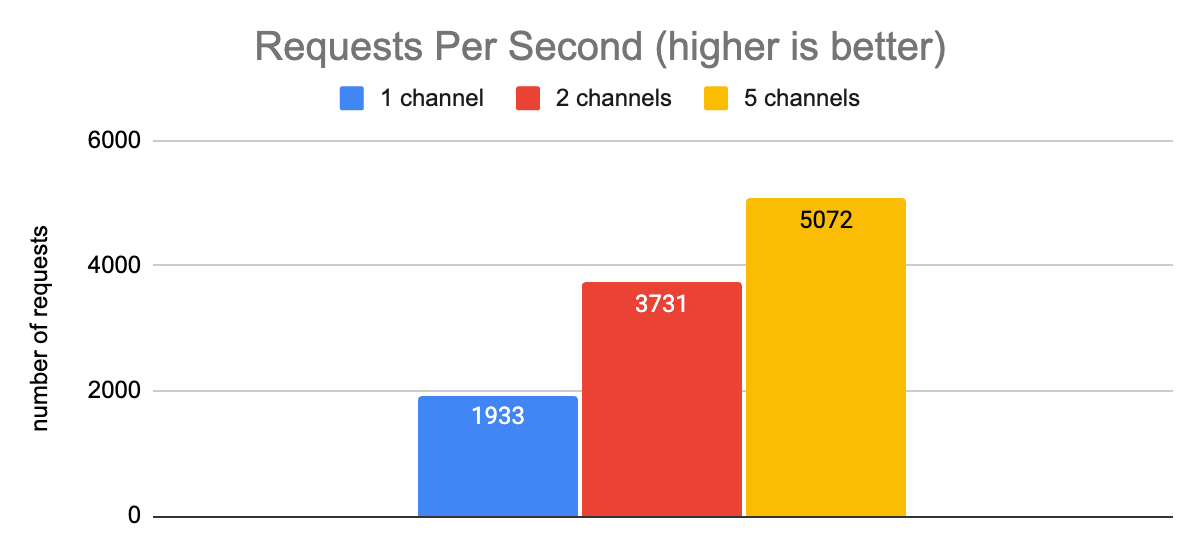
Laptop p50 latency with local subchannel pools (ms)
| Channels | 1 | 2 | 5 |
|---|---|---|---|
| p50 latency | 2,591 | 1,531 | 60 |
Lower latency is better.
Laptop throughput with local subchannel pools (requests/s)
| Channels | 1 | 2 | 5 |
|---|---|---|---|
| Throughput | 1,933 | 3,731 | 5,072 |
Higher throughput is better.
Moving from one channel to five cut p50 latency by a factor of 43 and increased throughput by a factor of 2.6 in this scenario. More than five channels produced diminishing returns because the single Node.js process was already CPU-bound.
The service continued to report latency below 3 ms during these tests. Network travel explains some difference between that value and the 60 ms client measurement, but it does not explain the full 20-fold gap. The callback backlog on the client remained the likely bottleneck.
Find the useful concurrency ceiling
We next held the client at five channels and varied the number of concurrent requests. The goal was not to maximize one metric in isolation. It was to find the point where more in-flight work stopped being worth the tail-latency cost.
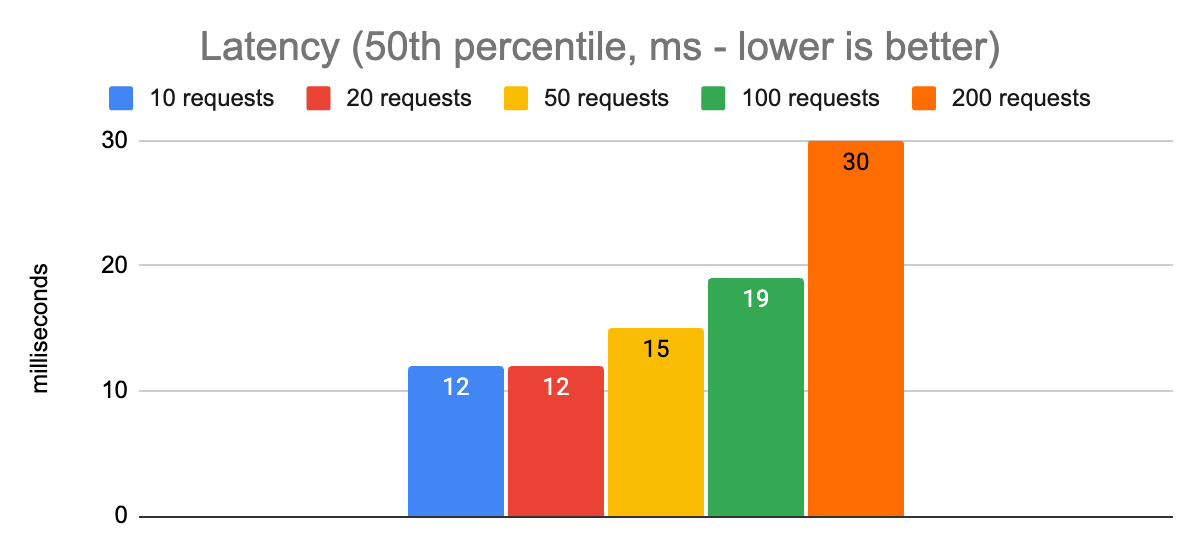
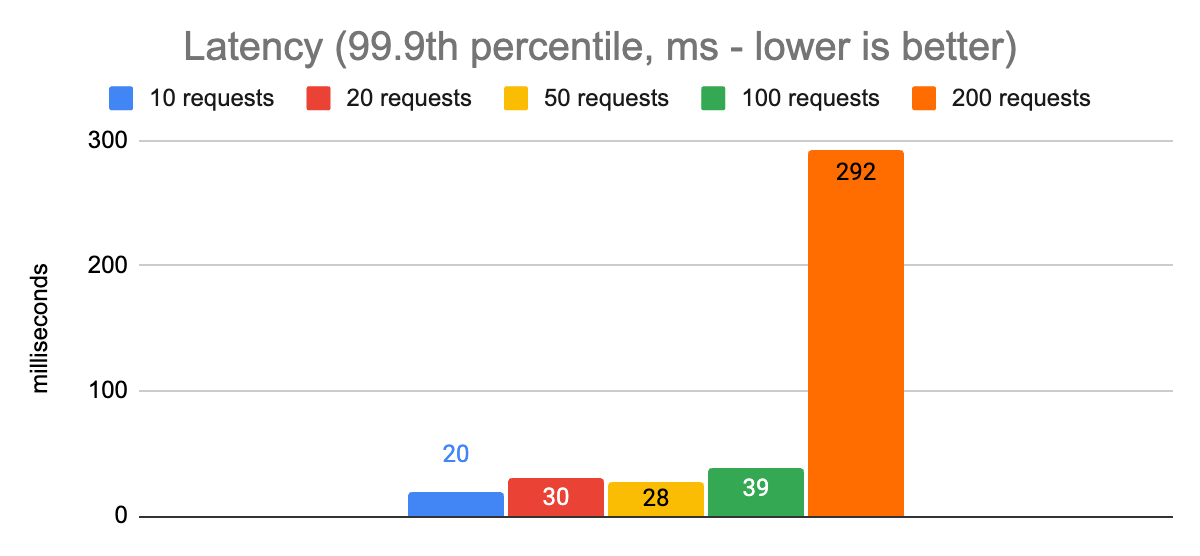
Laptop latency by concurrent requests (ms)
| Percentile | 10 | 20 | 50 | 100 | 200 |
|---|---|---|---|---|---|
| p50 | 12 | 12 | 15 | 19 | 30 |
| p99.9 | 20 | 30 | 28 | 39 | 292 |
Lower latency is better. The client used five channels with local subchannel pools.
Laptop throughput by concurrent requests (requests/s)
| Metric | 10 | 20 | 50 | 100 | 200 |
|---|---|---|---|---|---|
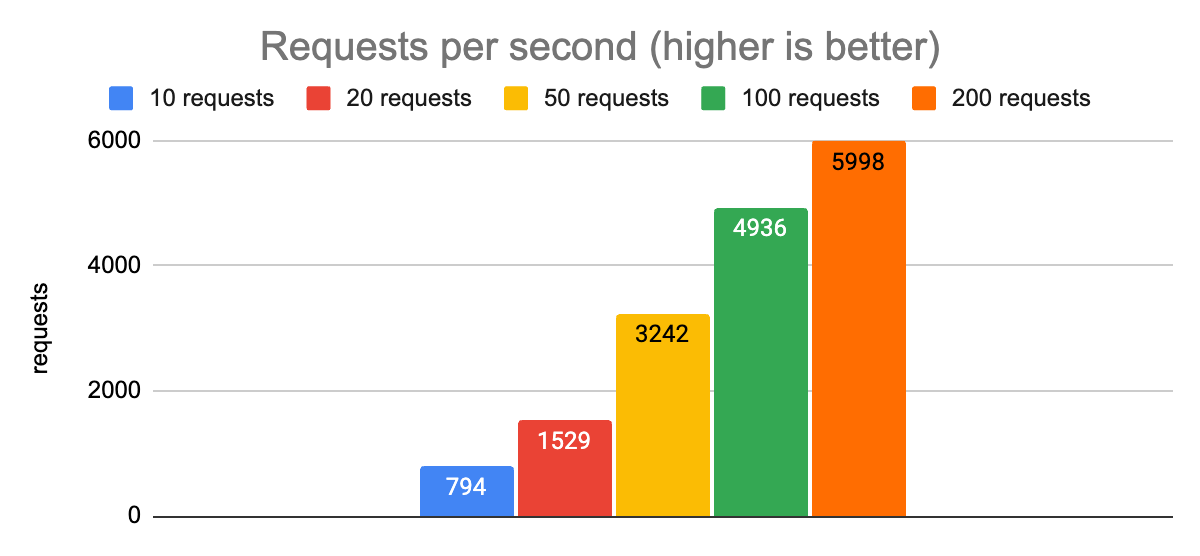
| Throughput | 794 | 1,529 | 3,242 | 4,936 | 5,998 |
Higher throughput is better. The client used five channels with local subchannel pools.
For this environment, about 100 concurrent requests was the useful ceiling. It delivered almost 5,000 requests per second while keeping p99.9 latency at 39 ms. Raising concurrency to 200 added about 1,000 requests per second but increased p99.9 latency to 292 ms.
Move the test in region
The production-like test ran on one c6i.4xlarge Amazon EC2 instance in the same AWS Region and Availability Zone as the service. We chose that instance class because it had shown more consistent network performance than smaller instances in our testing.
We set two client-side p99.9 latency targets:
- 20 ms for applications that can tolerate more cache latency in exchange for throughput, such as a cache protecting an expensive relational query.
- 5 ms for applications where low tail latency matters more than throughput.
These are experiment targets, not universal service objectives.
Concurrency still controlled the tradeoff
The in-region sweep kept five gRPC channels and tested 2 through 500 concurrent requests.
In-region latency by concurrent requests (ms)
| Percentile | 2 | 3 | 5 | 10 | 20 | 50 | 100 | 200 | 500 |
|---|---|---|---|---|---|---|---|---|---|
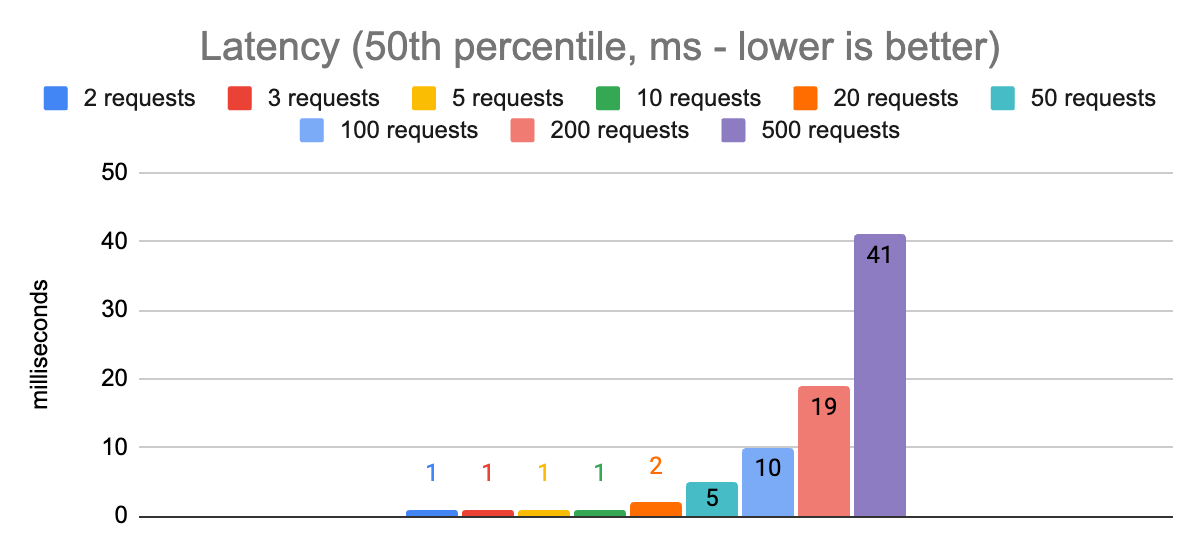
| p50 | 1 | 1 | 1 | 1 | 2 | 5 | 10 | 19 | 41 |
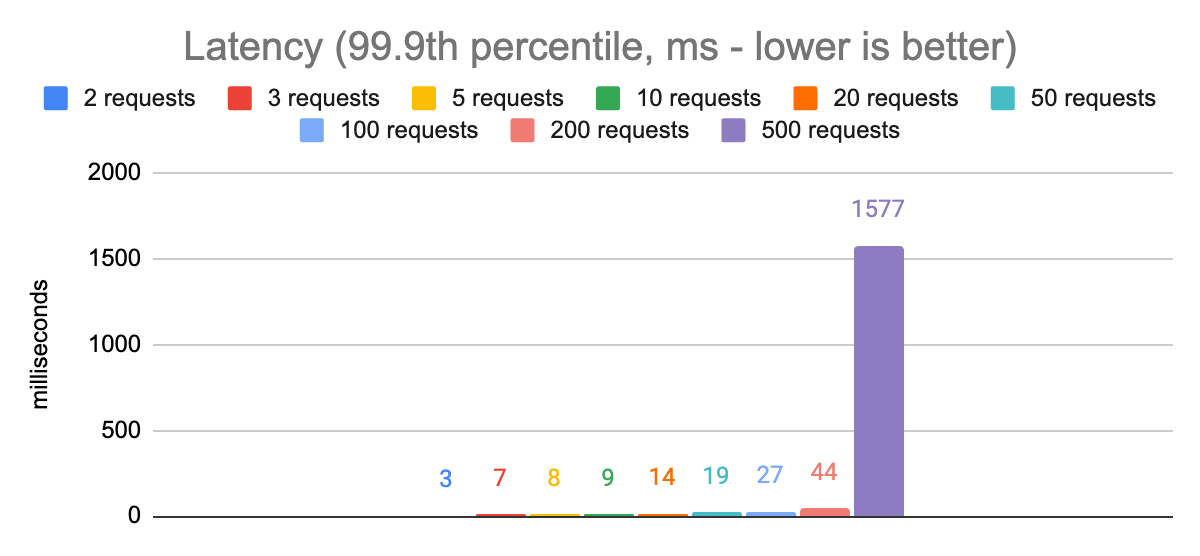
| p99.9 | 3 | 7 | 8 | 9 | 14 | 19 | 27 | 44 | 1,577 |
Lower latency is better. The client used five channels on one c6i.4xlarge instance.
In-region throughput by concurrent requests (requests/s)
| Metric | 2 | 3 | 5 | 10 | 20 | 50 | 100 | 200 | 500 |
|---|---|---|---|---|---|---|---|---|---|
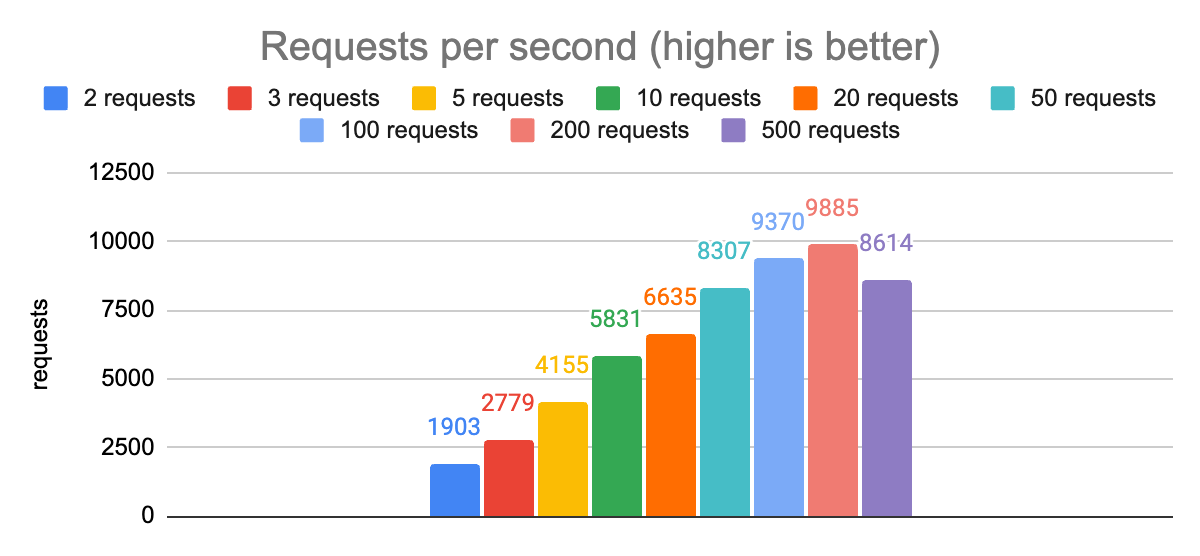
| Throughput | 1,903 | 2,779 | 4,155 | 5,831 | 6,635 | 8,307 | 9,370 | 9,885 | 8,614 |
Higher throughput is better. The client used five channels on one c6i.4xlarge instance.
The 50-request configuration met the first target with 19 ms p99.9 latency and 8,307 requests per second. Meeting the second target required two concurrent requests, which produced 3 ms p99.9 latency and 1,903 requests per second. That was roughly one quarter of the 50-request throughput, but an application could add capacity with more Node.js processes or client hosts.
At 500 concurrent requests, every metric regressed: p50 rose to 41 ms, p99.9 to 1,577 ms, and throughput fell to 8,614 requests per second. Once the client was saturated, queuing more work no longer helped.
Extra channels did little in region
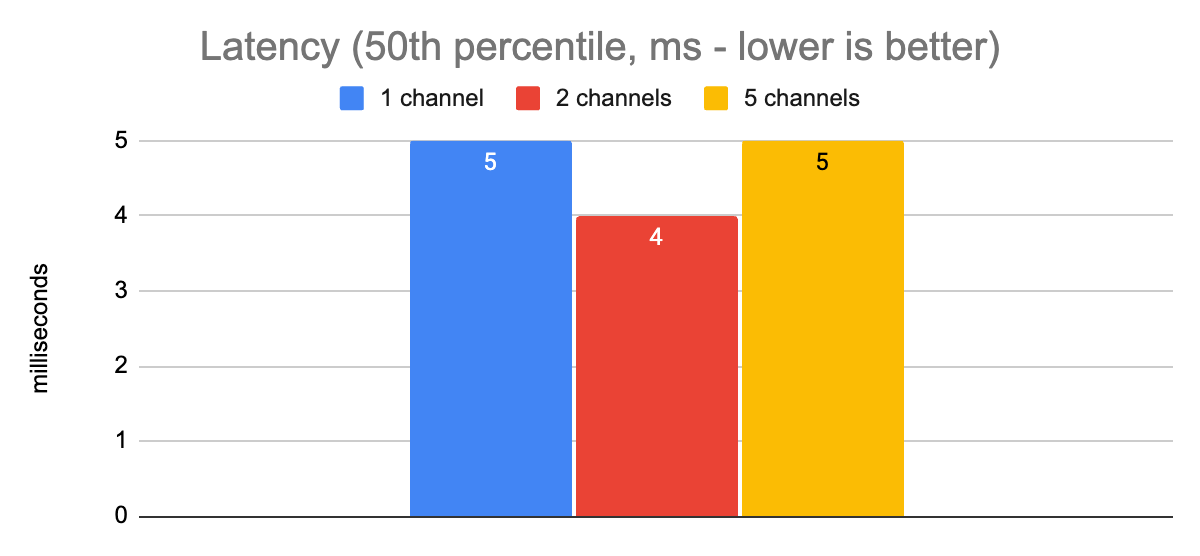
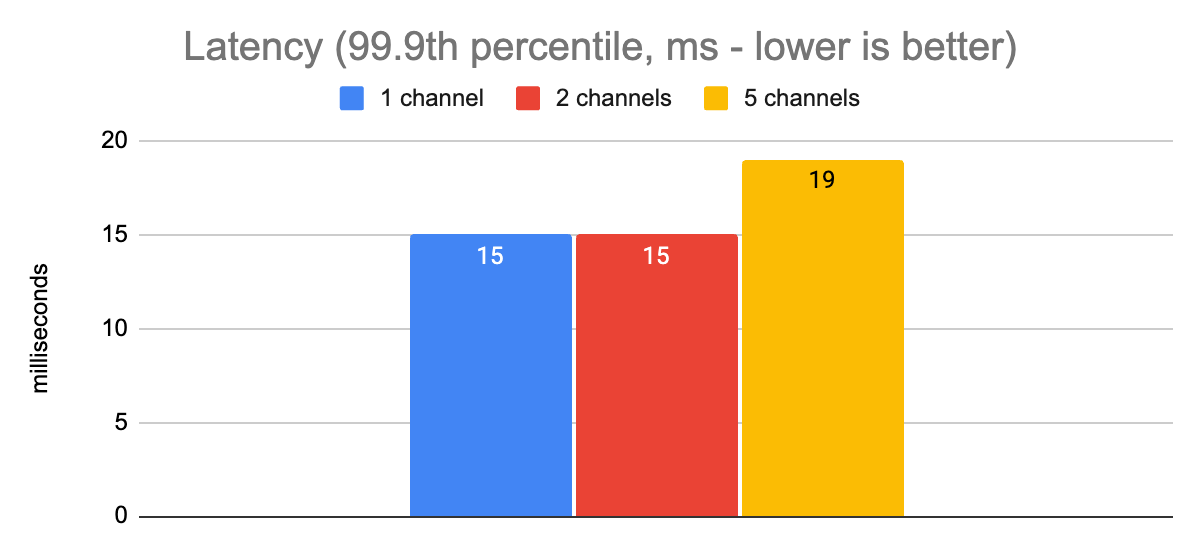
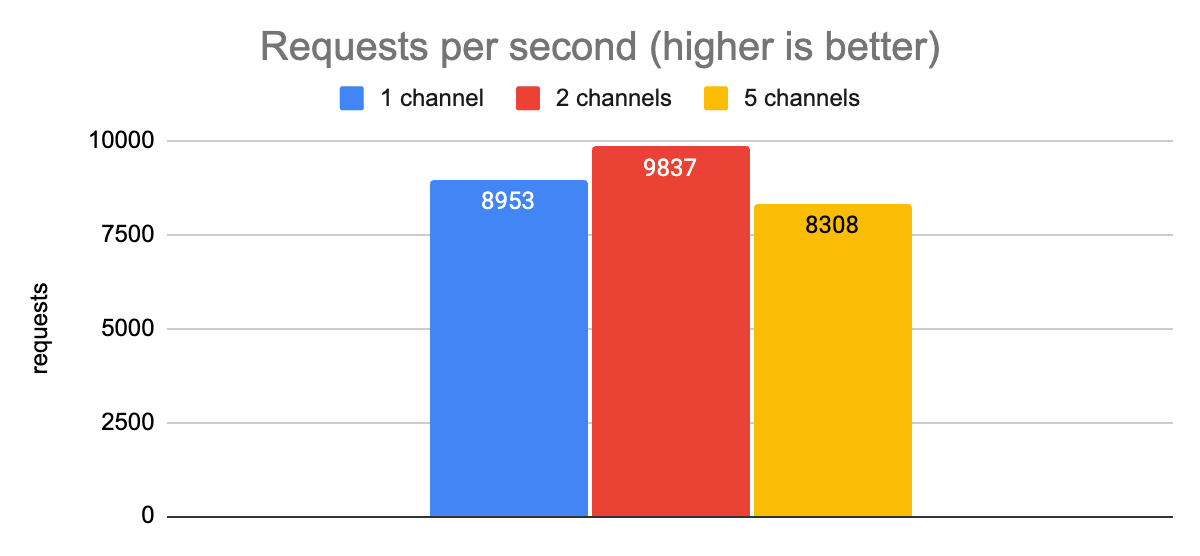
Finally, we held concurrency at 50 requests and swept the channel count again.
In-region latency by channel count (ms)
| Percentile | 1 channel | 2 channels | 5 channels |
|---|---|---|---|
| p50 | 5 | 4 | 5 |
| p99.9 | 15 | 15 | 19 |
Lower latency is better. The test held concurrency at 50 requests.
In-region throughput by channel count (requests/s)
| Metric | 1 channel | 2 channels | 5 channels |
|---|---|---|---|
| Throughput | 8,953 | 9,837 | 8,308 |
Higher throughput is better. The test held concurrency at 50 requests.
In this lower-latency environment, more channels did not improve latency. Two channels gave throughput a modest lift over one and also left a second connection available if the first had a connectivity problem. Five channels added no benefit because the Node.js process hit its CPU limit before it exhausted I/O capacity.
What the 2022 benchmark taught us
The benchmark supported four decisions for the client at that time:
- A local subchannel pool was necessary for multiple gRPC channels to add capacity.
- Five channels helped the high-latency laptop stress test, but not the low-latency in-region test.
- A concurrency ceiling protected tail latency from event-loop backlog.
- The best ceiling depended on the workload’s latency and throughput priorities.
Those findings informed prebuilt development and in-region configurations so most applications would not need to tune individual gRPC settings. The exact 2022 configuration names mentioned in the original release plan have since changed. Current JavaScript SDKs use the Configurations namespace, including Configurations.Laptop, Configurations.InRegion.Default, and Configurations.InRegion.LowLatency.
Start with the current SDK configuration guide, choose the environment profile that matches your application, and measure your own request path before overriding its defaults.