Shockingly simple: Tuning the Momento JavaScript cache client
We optimized our node.js gRPC client so you don't have to.
This post is part of a series that details how Momento thinks about our developer experience. Getting started with our serverless cache is shockingly simple, but that is only half of the story.
We believe that a delightful user experience includes writing and running code that interacts with your cache, and making our client libraries shockingly simple takes deliberate effort. To say it another way: our cache clients are a first-class concern.
If you haven’t already seen the first post in this series, Shockingly simple: Cache clients that do the hard work for you, read it for more info on our client-side user experience philosophy.
The Momento JavaScript client
This is a behind-the-scenes look at some of the work we’ve been doing to tune the Momento JavaScript client library to deliver an excellent out-of-the-box user experience. This includes performance (latency and throughput), resiliency, and debuggability. Most database and cache client libraries leave these crucial tuning choices as an exercise for the reader; our approach for developing and maintaining our client libraries is different (and frankly, better). We want to do this work so that you don’t have to. But we also want to share a bit of “how the sausage is made!”
If you are just interested in getting up and running with Momento in JavaScript or TypeScript, then, good news! You don’t need to read the rest of this post. We’ve got you covered! Just go straight to our Getting Started guide and you’ll be up and running with a Momento cache in minutes, and then check out our JavaScript examples to see how you can interact with your Momento cache in just a few lines of code.
If you’re more interested in the destination than the journey, you can see a summary of our findings in the tl;dr section toward the end of the post.
For the adventurous: read on and we’ll get into some of the implementation details!
gRPC
Momento is built on gRPC. We hope you will never need to know or care about this, and we put a lot of effort into making sure that our client libraries do not require you to. However, for the purposes of this article, it’s worth mentioning it because most of the tuning and experimentation we’ll be doing has to do with the gRPC configuration.
If you’re not familiar with gRPC, here are some highlights:
- It’s a framework for Remote Procedure Calls, created by Google.
- It is based on the HTTP/2 protocol, which extends HTTP/1.1 with features like multiplexing requests for improved performance.
- It uses Google’s protocol buffers to define a binary wire format, which reduces network I/O when compared to more verbose formats like JSON.
- You can largely think of it as an alternative to building a REST service using HTTP/1.1 and JSON.
- It’s a Cloud Native Computing Foundation incubation project.
Node.js and CPU utilization
Momento provides client libraries for most popular programming languages. When exploring the performance of our JavaScript (node.js) client, there is an important difference from some of our other client languages like C#, Java, Go, and Rust: the default runtime environment for a node.js process can only run user code on a single CPU core.
Node.js provides mechanisms (such as spawning multiple processes and using inter-process communication) that you can opt into to take advantage of additional CPUs, but they’re at least a few steps off of the beaten path, and it’s not easy to integrate into a general purpose library or SDK without forcing our users to adapt to a specific execution strategy that might not fit well in their environment. For that reason, we focused on squeezing as much performance as we can out of a single process, running Momento client code on a single CPU.
An interesting thing about this exercise is that CPU is likely to become our performance bottleneck much earlier than it will in other languages, so it’s important for us to be cognizant of any places where we have an opportunity to reduce CPU consumption.
Tuning the Momento JavaScript client
Without further ado, let’s dig into some observations from some recent work we did to tune our JavaScript client!
Hello Laptop!
For most developers, the first experience you will have with the Momento client library is going to be from your laptop. So we want to make sure that the example code and out-of-the-box configurations are going to work well in your dev environment.
This has a couple of implications. First of all, it means that your network latencies may be a little higher than they will be in most prod environments, so we want to be a bit more lenient with timeouts.
Secondly, after you get past the “Hello World!” example, we know what you’re going to want to do next. You’re going to want to write a loop that spawns off a bunch of async function calls to do gets and sets on the cache, to see how fast it is and how much throughput you can get.
Now, we all know that spamming a bunch of async requests as fast as possible in a loop is not what we want to do in our production code. Something something contention, something something backpressure, BLAH BLAH BLAH. But it’s still the first bit of code we want to write to kick the tires. Pretty much every time… am I right? 🙂
So we played around with that to see what the performance looked like. We wrote some code that would spam a configurable number of concurrent requests in a loop, and tested it out with different values ranging from 10 to 10,000. The performance was okay, but we knew that it could be better.
The perils of thousands of concurrent requests on one CPU core
As we mentioned earlier, it’s very easy to become CPU-bound if you’re doing anything computationally expensive in a language that can only use one core. The Momento SDK is decidedly not doing anything computationally expensive; a little bit of encryption and serialization, but otherwise almost entirely network I/O.
Still, if we fire off 5,000 concurrent loops that are spamming requests, then we have stacked up a lot of work on the node.js event loop. Most of the queued tasks are getting starved, and their callback may not be called for quite some time after we actually have a response from the server. Thus, their client-side latencies appear to be monstrously large compared to the latencies that the server is reporting.
There are a few strategies that we can employ to improve things:
- Look for optimizations in our JavaScript code so that we are doing less work there.
- Make sure that we are maximizing the amount of work that the node runtime can delegate to the underlying I/O layer, to free up more CPU for the JavaScript code.
- Do a better job of limiting the amount of work we are queuing up at once, so that we don’t have so many task callbacks competing for the scarce resource (CPU).
We’ll skip over the gory details for item 1, since they’re not really unique to Momento or to client libraries. Let’s start with the second item, and see if there are some tweaks we can make at the gRPC layer to improve throughput. Once we’re done with that we move on to item 3 and see if we can find the sweet spot for the number of concurrent requests to maximize throughput and minimize latency.
Maximizing I/O: Multiple gRPC channels
gRPC servers (and HTTP/2 servers in general) set a limit for the maximum number of concurrent streams per connection. A common default value for this setting is 100, and that happens to be the value that Momento’s cache service uses.
Armed with this knowledge, we can do some reasoning about what happens when we have 5,000 concurrent requests running in our JS code. The Momento client was using a single gRPC channel to send requests to the server, so this effectively guaranteed that 4,900 of the requests would be blocked waiting for a spot in that channel at any given time.
In this situation, any program will seem slow, no matter how fast the underlying client and server are. In fact, in our laptop environment in this scenario, we observed p50 client-side latencies of over 2 seconds! This obviously is not good enough, but it’s a starting point that we can use to gauge improvements.
Our first experiment was to use more than one channel to see if that improved throughput. The initial results were not what we expected!
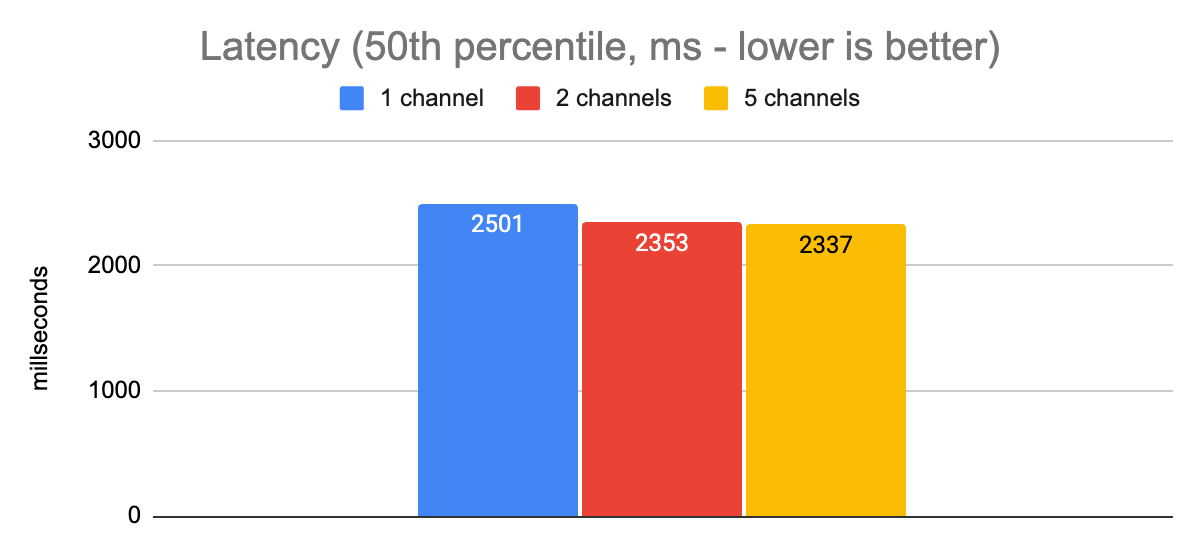
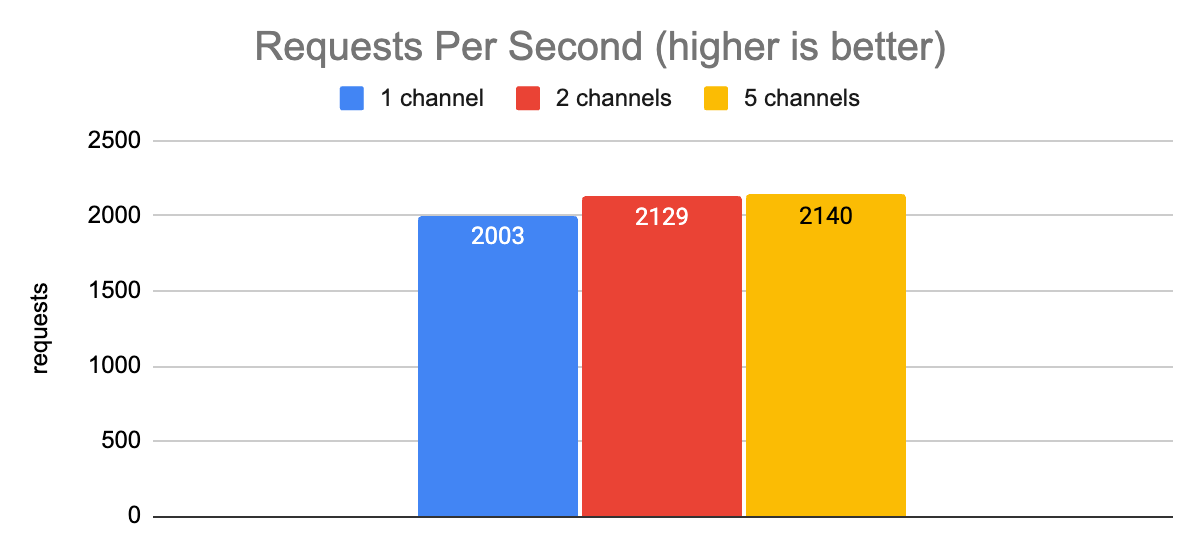
There was no improvement (given margin of error) in either latency or throughput when we varied the number of channels. Thankfully, shortly after that experiment we discovered that the issue was the grpc.use_local_subchannel_pool setting. According to the docs, when this is set, gRPC “uses a local subchannel pool within the channel”. Otherwise it uses a global subchannel pool.
This setting turned out to be a key one for the nodejs grpc-js library. After toggling it on, we saw much better results.
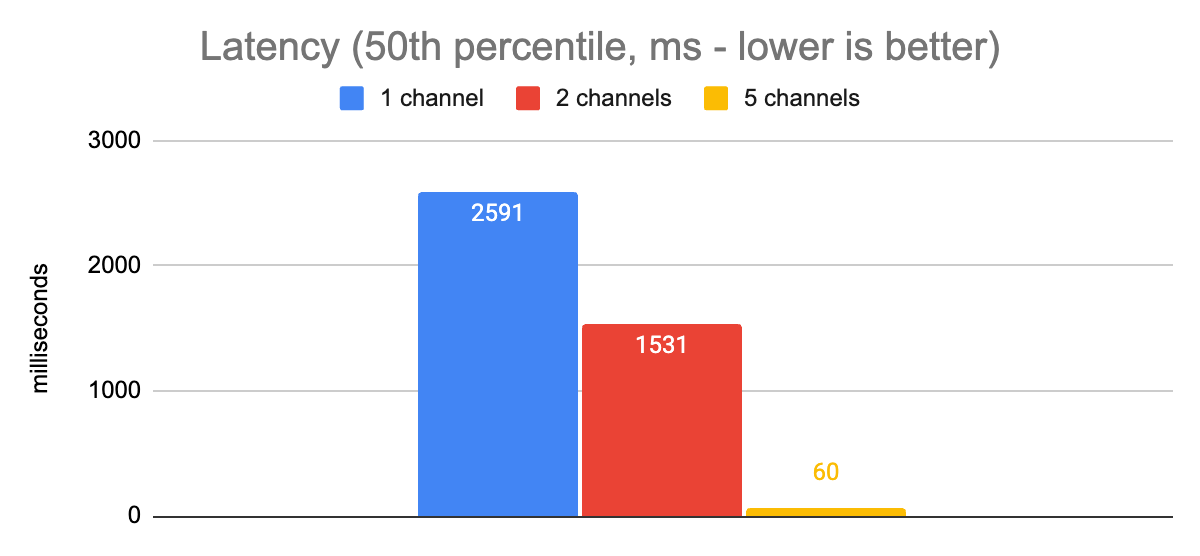
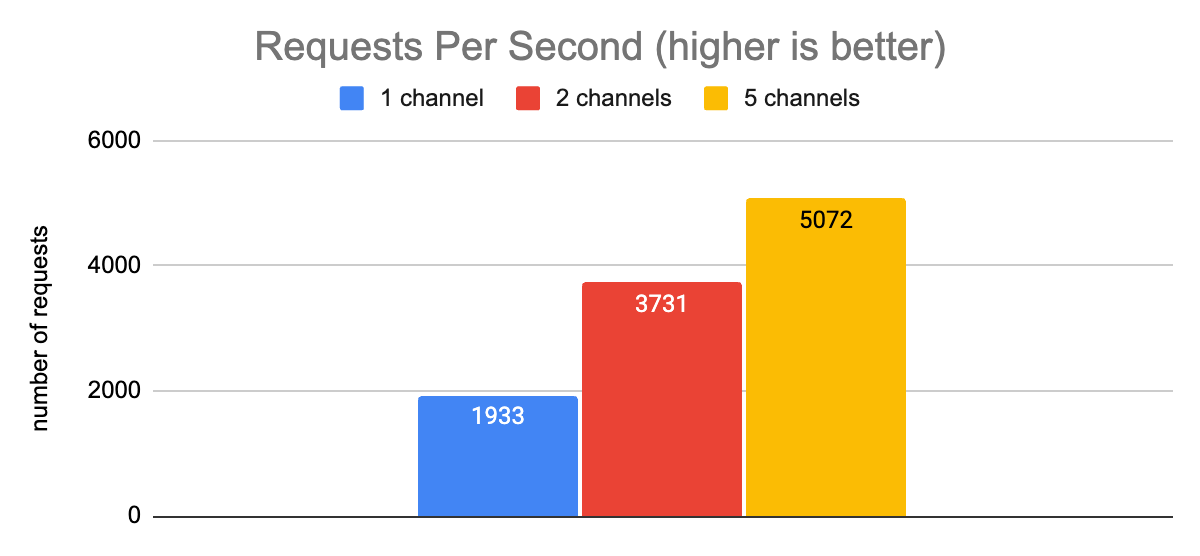
Here we can see that when moving from 1 channel to 5 channels, our p50 latency decreased by a factor of 43, and our throughput increased by a factor of 2.6. These are obviously major improvements.
In our test environment, increasing the number of channels beyond 5 saw diminishing returns. Because the node process is still CPU bound with such a large number of concurrent requests, additional request capacity at the I/O level did not yield further improvements.
One key thing to note here, though, is that the server-side latencies were consistently less than 3ms throughout the duration of these tests. Obviously, there’s some network latency added in when we measure client-side latencies between the laptop and the server, but that does not come close to explaining the whopping 20x delta in latencies (60ms client-side, 3ms server-side) that we are observing between client-side and server-side measurements. We’re still CPU-bound due to the large number of concurrent requests.
Optimizing number of concurrent requests
Next, we moved on to experimenting with what number of concurrent requests gave the best performance. For now, this gives us a means to provide guidance to users on the maximum amount of concurrency they should target. In an upcoming release of the client library we plan to put a work queue in place to provide an upper bound on the concurrent requests in cases where a user exceeds the ideal value, so that developers will get the best performance out-of-the-box.
Here are some graphs showing the performance at different levels of concurrency:
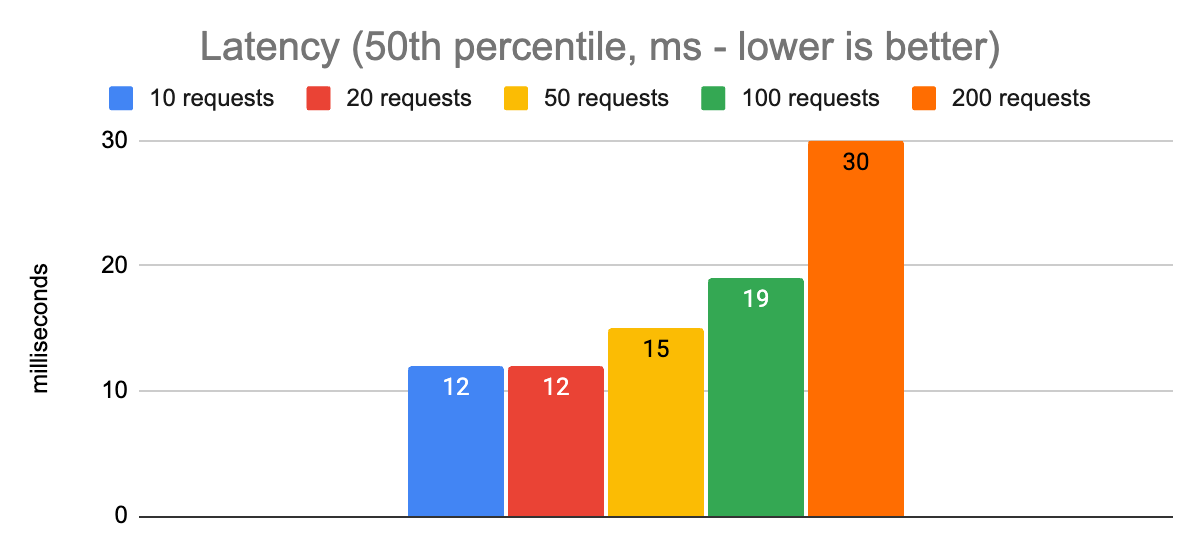
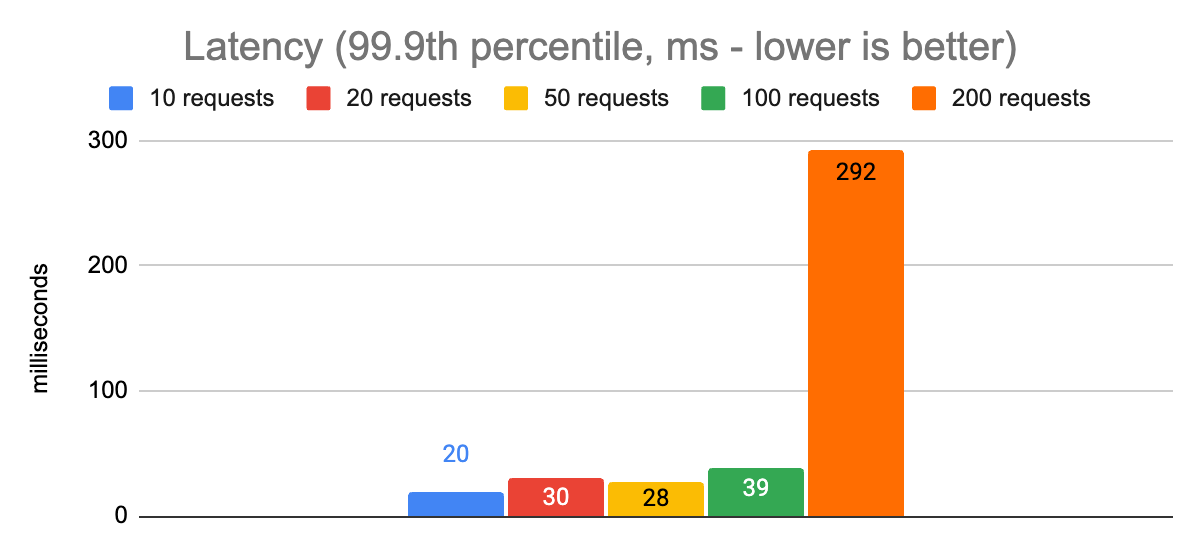
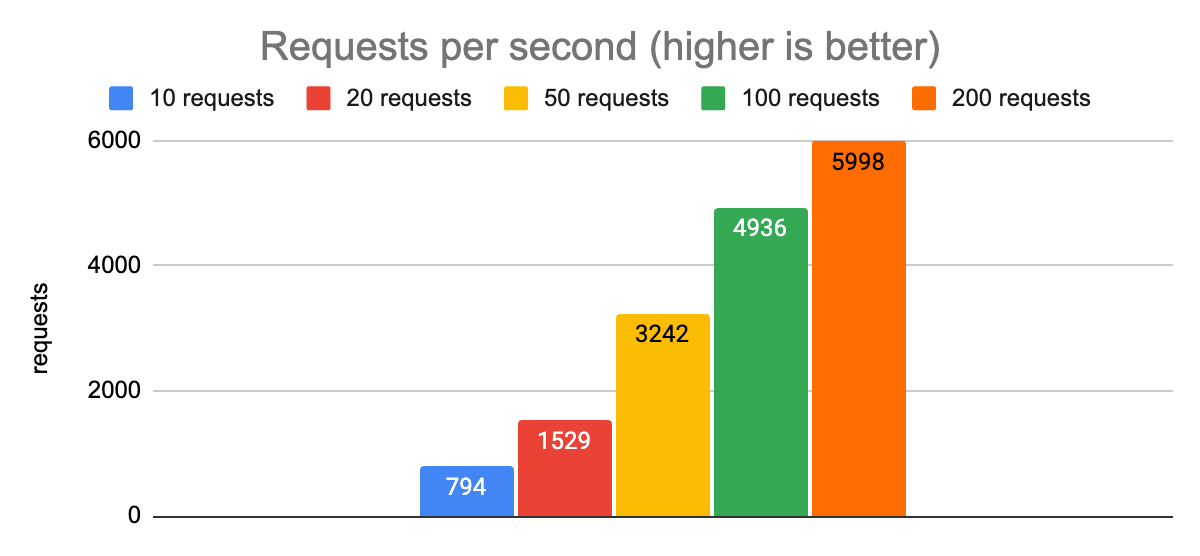
Notice that there is an obvious spike in p50 and especially p99.9 latencies when we allow 200 concurrent requests to be in flight, compared to limiting the app to 100. The overall throughput is a little higher, but that will almost never be the right choice for an application when it comes at the expense of increasing p99.9 latency from 39ms to 292ms. Anecdotally, these charts show us that the sweet spot for the maximum number of concurrent requests in this environment is going to be around 100. That gives us p50 and p99.9 latencies that are reasonably close to the ones we measured with 10, 20, and 50 requests, while increasing our throughput to almost 5,000 requests per second.
We experimented with several other settings but we’ll spare the gory details, as these were the ones that made the most noticeable impact on performance. So now that we’ve wrapped things up here in laptop-land, let’s get serious and go try the latest settings out in a more production-like environment!
Moving from the laptop to the cloud
Let’s see what the performance looks like from an AWS EC2 instance running in the same region and availability zone as the service. This eliminates the majority of the network latency so the client-side numbers we get should look much closer to the server-side latency numbers (we use a c6i.4xlarge instance type because we have observed more consistent network performance in this class than with smaller instances).
Tuning goals
Now that we are done experimenting in the laptop environment, we need to get more concrete about what our goals are for tuning in a production environment. When tuning a client application for performance, there is often a tradeoff to be made between minimizing latency and maximizing throughput. One configuration might provide higher throughput, but with more resource contention on the client it may also result in elevated client-side latencies. Another configuration may prefer ensuring that we avoid any resource contention, and thus we achieve the lowest possible latencies – but a cost of reduced overall throughput.
For this tuning exercise we choose two different latency targets and explore how we can maximize throughput for each:
- client-side p99.9 latency of 20ms: this is a reasonable target for applications that are caching data that is extremely expensive to compute (e.g. a big JOIN query in a complex relational database schema), and when the application’s own latency requirements are lenient.
- client-side p99.9 latency of 5ms: this is a better target for an application whose own latency requirements are absolutely critical.
Revisiting the number of concurrent requests
For the prod environment, we’ll skip the “huge number of concurrent requests” exercise; we have a general idea of the range of values that give us reasonable latencies and throughput. We’ll stick with 5 gRPC channels for now since that was the best value for the laptop environment.
Here are the results of some runs with 5 gRPC channels and different numbers of concurrent requests:
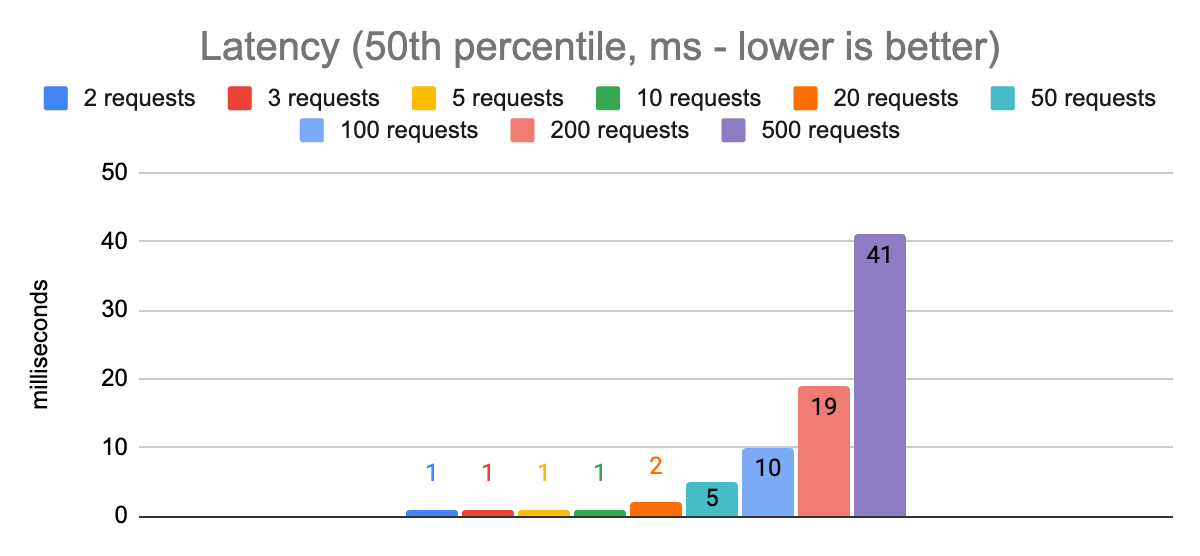
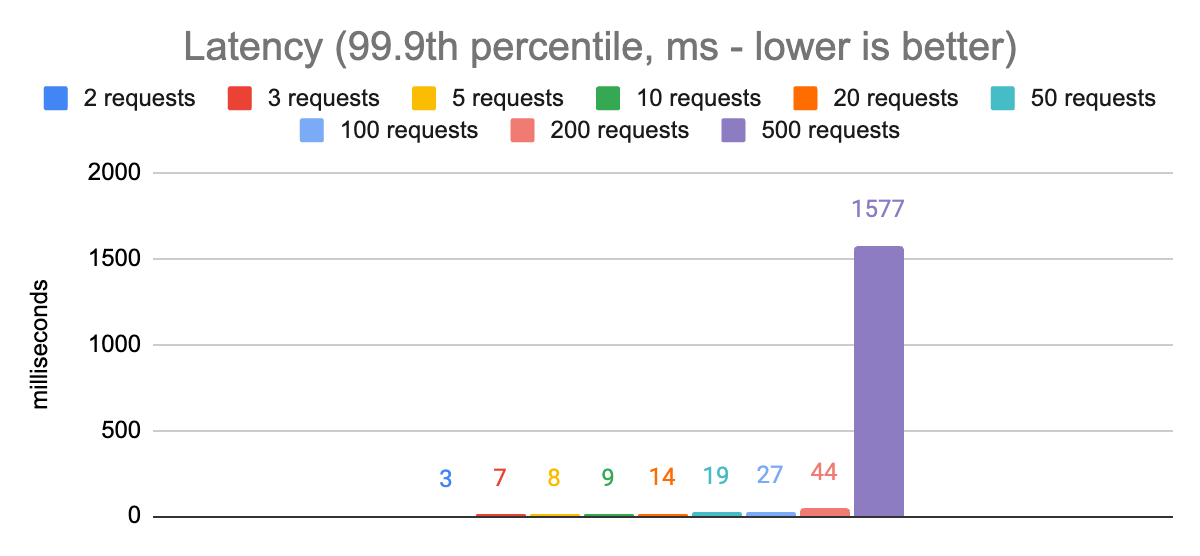
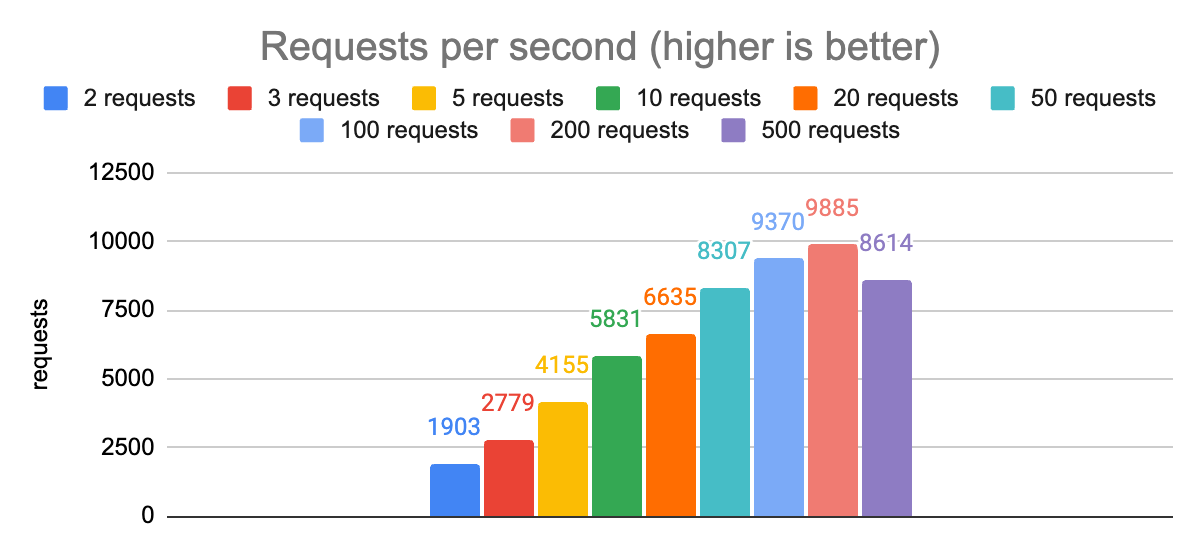
The most stark observation from these charts is that there is a huge impact on p99.9 latencies when comparing 200 concurrent requests to 500. The p50 latency also increases dramatically, and even the throughput gets worse. So we can rule out that configuration and zoom in on the remaining ones:
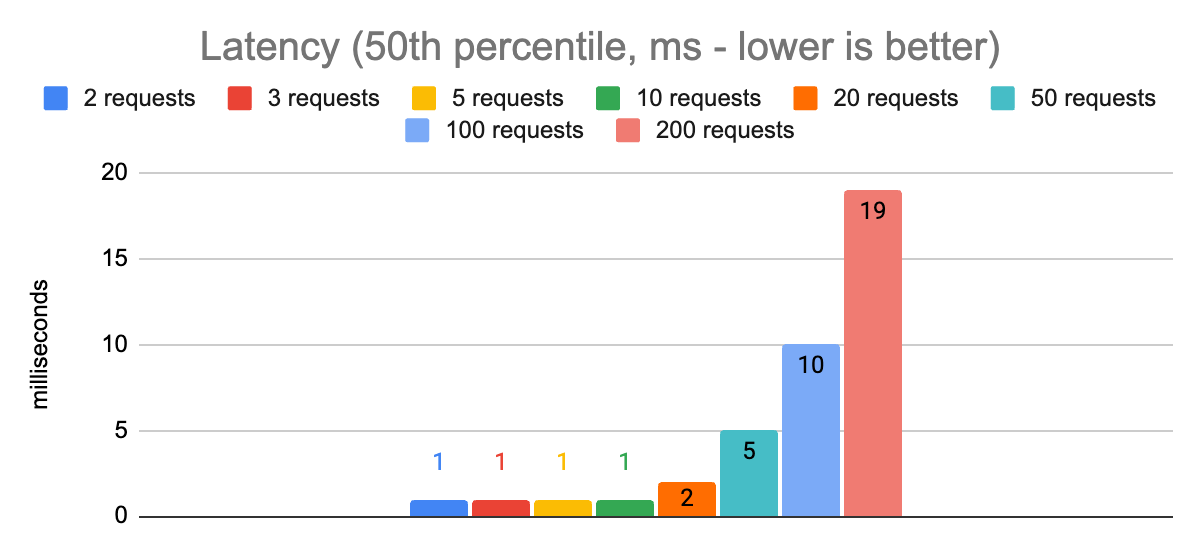
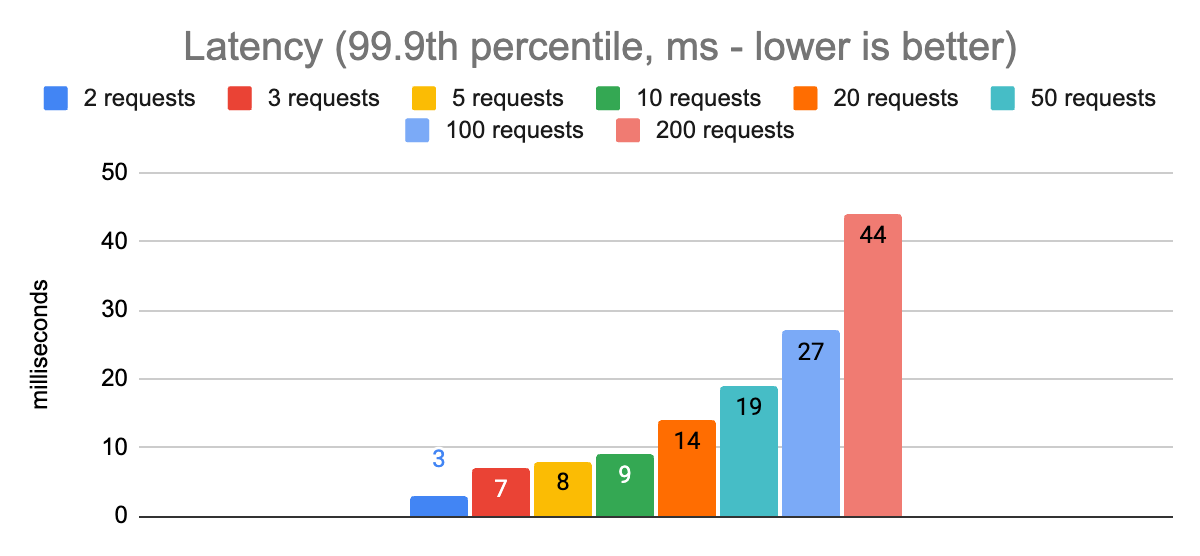
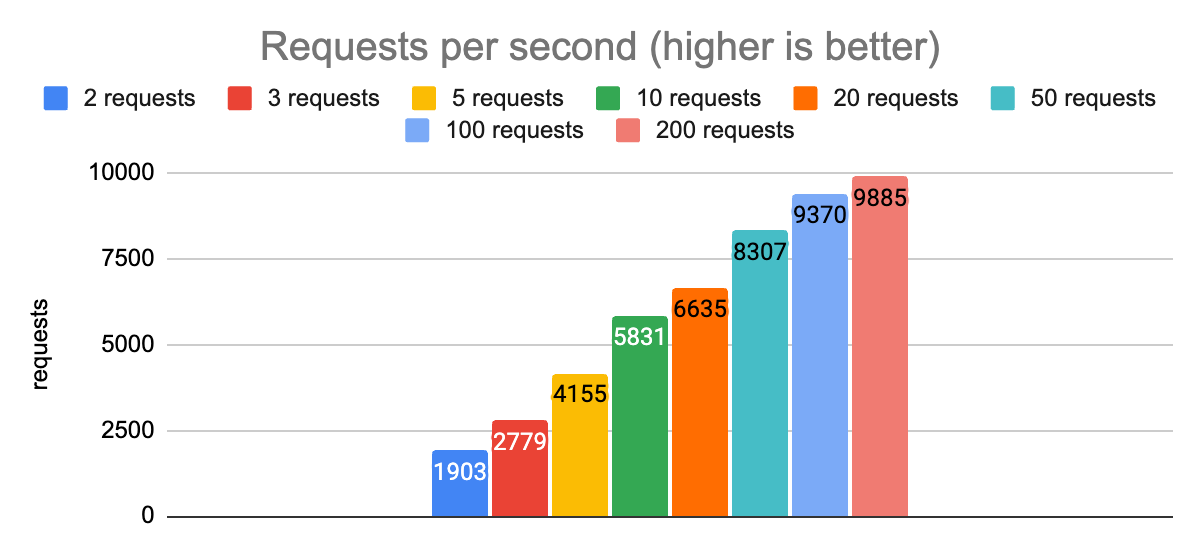
From these charts we can see that with 50 concurrent requests we are able to hit our first target of a p99.9 latency less than 20ms. We are able to achieve a throughput of 8300 requests per second using a single node.js process.
For our second target, p99.9 latency of less than 5ms, we need to reduce the number of concurrent requests to 2. Doing this also reduces our throughput to 1900 (a 4x reduction), but this is the right trade-off for latency-sensitive applications (remember, overall capacity can still be improved by scaling out to multiple node.js processes or client nodes).
Revisiting the number of gRPC channels
Let’s check and see how things look with different numbers of gRPC channels and a max of 50 concurrent requests:
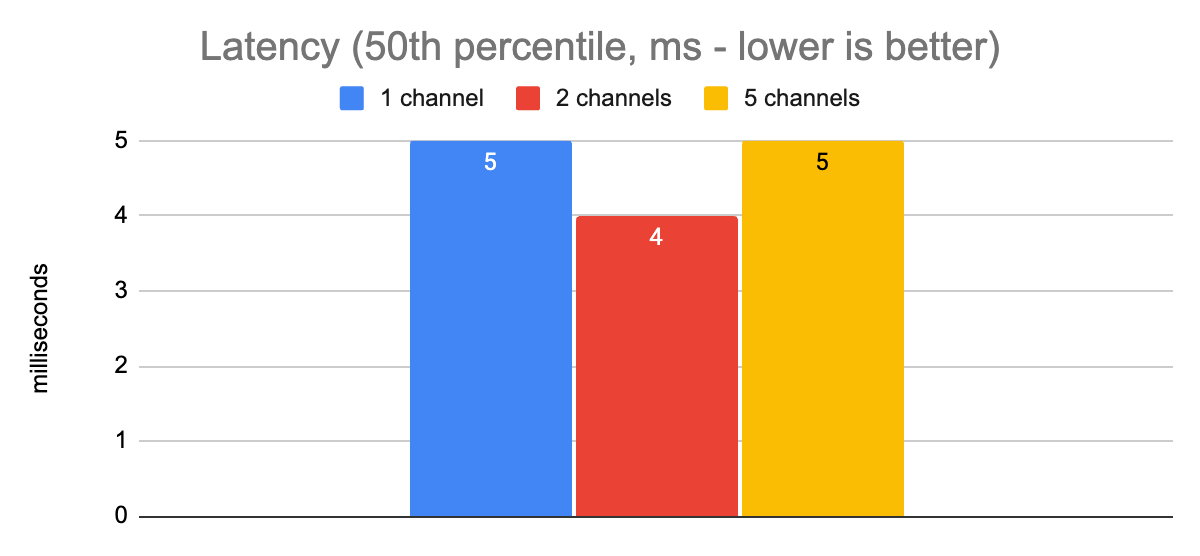
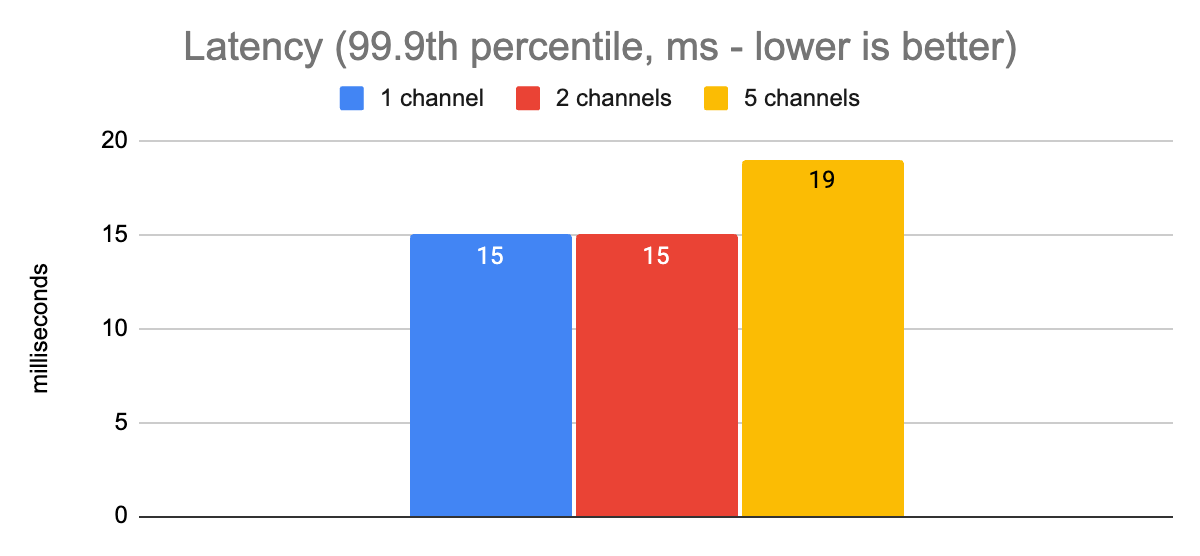
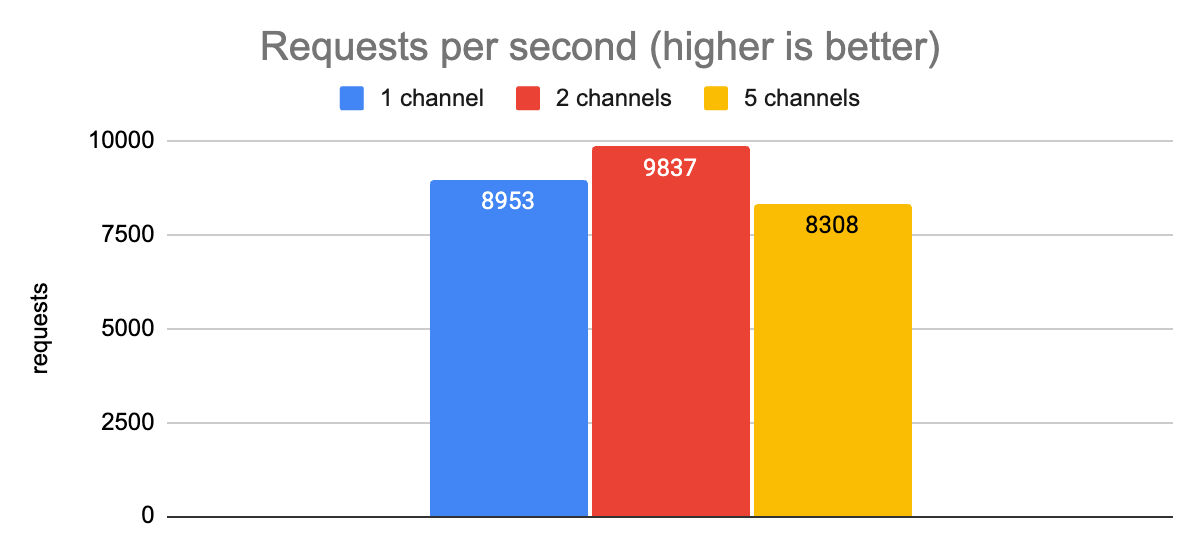
From this data, we see that in this low-latency production environment, we don’t achieve any meaningful latency improvements by increasing the number of channels. The latencies are low enough that we seem to hit our single-core CPU bottleneck earlier than any I/O bottlenecks. We do see a slight improvement in throughput with two channels, though; and generally speaking, keeping at least two channels open is a good idea so that we have a fallback if there is some kind of connectivity issue on the TCP connection for one of them.
tl;dr
So, what have we learned here today? Here are the key takeaways:
- To get the benefits of using more than one gRPC channel in node.js/grpc.js, you need to make sure to set the grpc.use_local_subchannel_pool setting.
- Using 5 gRPC channels can make a huge difference in an environment with higher latencies and high numbers of concurrent requests (40x improvement in latency in our test scenario!)
- Capping the maximum number of concurrent requests on the wire has a big impact on both latency and throughput.
- With a maximum of 50 concurrent requests, we are able to achieve a p99.9 client-side latency of < 20ms, with a throughput of over 8300 requests per second, from a single node.js process.
- With a maximum of 2 concurrent requests, we are able to achieve a p99.9 client-side latency of < 5ms, with a throughput of 1900 requests per second, from a single node.js process.
- In a low-latency environment (e.g. EC2 in-region), using more than one gRPC channel does not have a measurable impact on performance.
With these findings, we now have a solid basis for defining pre-built configurations for dev and prod environments. We used these to initialize the default settings in the Momento JavaScript client, and in an upcoming release that will be available soon, you’ll be able to choose between the pre-built configurations like PreBuiltConfigs.Laptop, PreBuiltConfigs.InRegion.PrioritizeThroughput, and PreBuildConfigs.InRegion.PrioritizeLatency. Of course, you’ll also be able to manually tune the settings as you see fit, but our goal is to cover the 90% cases so that you don’t have to!
Next up: Python
The next post in this series will cover our tuning work for the Python client. While node.js and Python have some similarities that are relevant for this exercise (in particular, the fact that the default runtime environments target a single CPU core), you might be surprised to see some of the differences in the ideal gRPC configuration settings between the two.
Or… you might just be happy to know that you don’t need to worry about this stuff with Momento, because we want to take care of it for you. In which case, you should go check out our Getting Started guide, and see how easy it is to create a cache for free in just minutes!
Until next time… stay simple, my friends!


