
A cache client should protect an application from avoidable connection-management work without hiding the latency-throughput tradeoff. In our first .NET tuning experiment, that balance looked different from JavaScript and Python because a C# process could use all the machine’s CPU cores and the .NET gRPC library could open additional connections for us.
This 2022 benchmark started with an intentionally pathological workload: 5,000 concurrent asynchronous calls. We then capped the requests allowed on the wire and measured how the cap changed throughput, tail latency, connection count, and resource use. The result informed the original pre-built configurations for the Momento .NET client.
This is the fourth post in our series about the work behind a simple developer experience. The first post explains why the client should own this tuning, and the JavaScript and Python posts show how their runtime constraints produced different results.
Historical benchmark: The measurements, service limits, and configuration names below describe the client and service as they existed in 2022. The post does not record the SDK, .NET, or gRPC versions; request and value shapes; test duration; repetitions; complete laptop specifications; or uncertainty. Several imported chart references also point to the same files, so only three distinct charts survive in the site source. Treat the results as a record of the original tuning work, not as a current SDK comparison or reproducible benchmark.
Why .NET changed the tuning problem
Momento clients use gRPC for remote procedure calls. At the time of this experiment, we described the Momento server limit as 100 concurrent streams per channel. In the observed .NET path, additional connections carried overflow requests. That limit made request concurrency and connection management important parts of client tuning.
The earlier JavaScript and Python experiments had another constraint: their default runtime environments ran user code on one CPU core. Managing concurrent requests helped those clients avoid callback backlogs and CPU thrashing. JavaScript also benefited from multiple gRPC channels, while Python did not.
C# was the first language in the series whose default runtime could use all of a machine’s CPU cores. We did not know whether CPU, connection capacity, or network I/O would become the first bottleneck.
The experiment therefore began with a deliberately naive load generator that spawned 5,000 C# async Tasks. That is not a production recommendation. It is a stress case designed to expose the first resource limit.
Automatic connections solved one problem and created another
We expected one gRPC channel to leave 4,900 of those requests waiting behind the 100-stream connection limit. That is what we had observed with the earlier clients, but the .NET path behaved differently.
I used the lsof command to watch connections between the client and server. In this 2022 configuration, the .NET gRPC library opened another connection when the active requests could no longer fit on the existing one. Up to 100 concurrent requests used one observed connection; 101 used two; 201 used three; and 301 used four.
That automatic behavior removed the need for application code to create, destroy, and route work across several channels. Neat!
It also meant that 5,000 concurrent requests could produce as many as 50 connections. Past a certain point, more in-flight work delivered diminishing returns while increasing client and server overhead. We needed a concurrency ceiling that kept the useful parallelism without creating connections that added little value.
Find the laptop’s useful concurrency range
We first varied request concurrency on a laptop. Only two distinct laptop charts survive in the imported source: throughput and p99.9 latency. The repeated third image does not preserve a separate metric.
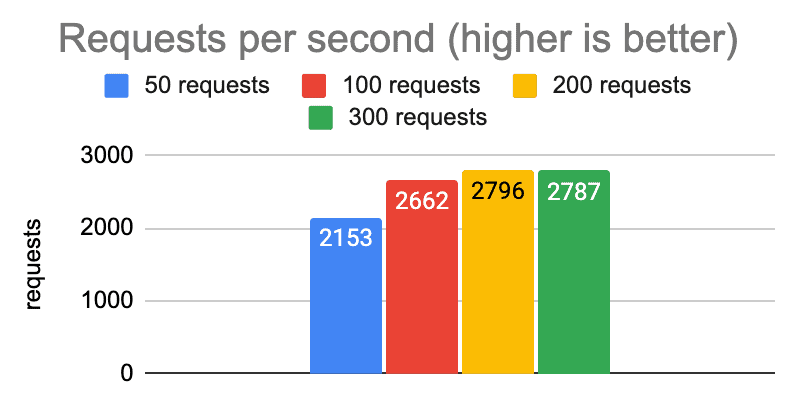
Laptop throughput by concurrent requests (requests/s)
| Metric | 50 | 100 | 200 | 300 |
|---|---|---|---|---|
| Throughput | 2,153 | 2,662 | 2,796 | 2,787 |
Higher throughput is better. The article does not record the request mix, value size, run duration, or repetitions.
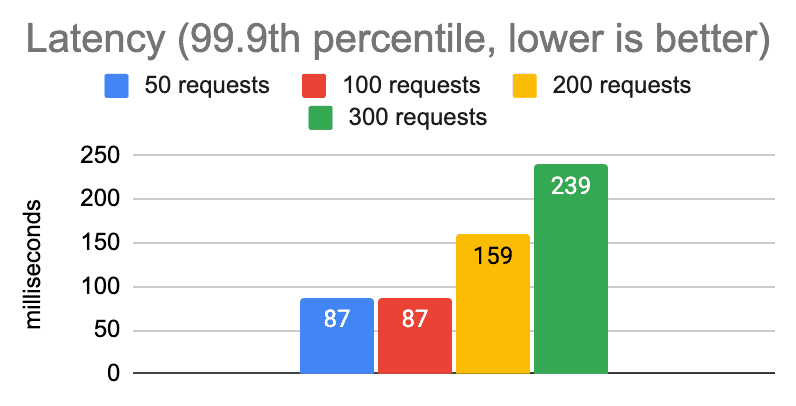
Laptop p99.9 latency by concurrent requests (ms)
| Metric | 50 | 100 | 200 | 300 |
|---|---|---|---|---|
| p99.9 latency | 87 | 87 | 159 | 239 |
Lower latency is better. p99.9 is the latency at or below which 99.9% of requests completed in this test.
The charts show diminishing throughput returns before 5,000 requests and a steep tail-latency cost above 100. We added an internal concurrency limit to the Momento .NET client using the usual async Task API. The limit was invisible to client users, but it capped how many requests could reach the wire and therefore how many connections the gRPC layer would create.
Application code could still issue 5,000 asynchronous calls. With only 100 allowed on the wire at once, though, the same test produced more consistent throughput and latency. We attributed that improvement to less scheduling and connection overhead, but this experiment did not isolate either mechanism independently.
The bottleneck moved away from CPU
The C# process drove more traffic than the single-process Python and JavaScript tests because it could use multiple cores. In a separate laptop observation, the client reached about 11,000 requests per second while using roughly 20% CPU. The earlier single-process Python and JavaScript runs peaked near 6,000 requests per second.
We inferred that network I/O had become the laptop’s limiting resource before CPU. The benchmark did not isolate network throughput, however, so that remains an explanation for the observation rather than a separately proven cause.
Move the test in-region
We next ran the load generator on a c6i.4xlarge Amazon EC2 instance in the same region as the Momento service. We had observed more consistent network performance from that instance class than from smaller instances. Reducing network distance also let the client-side latency measurements approach the service-side measurements more closely.
We chose two goals for this experiment:
- p99.9 below 20 ms: a possible balance for applications that can tolerate more cache latency in exchange for throughput.
- p99.9 below 5 ms: a stricter target for applications where tail latency matters more than throughput.
These were tuning goals, not universal application requirements.
The imported source no longer contains distinct cloud p50 and p99.9 chart files. Its two latency slots repeat the laptop-throughput image, so the claims below are preserved from the article’s prose rather than reconstructed from the wrong chart.
The test met the first goal with 200 concurrent requests. It met the stricter goal with 25 concurrent requests, reducing throughput from about 26,000 to about 11,000 requests per second.
One distinct cloud throughput chart does survive:
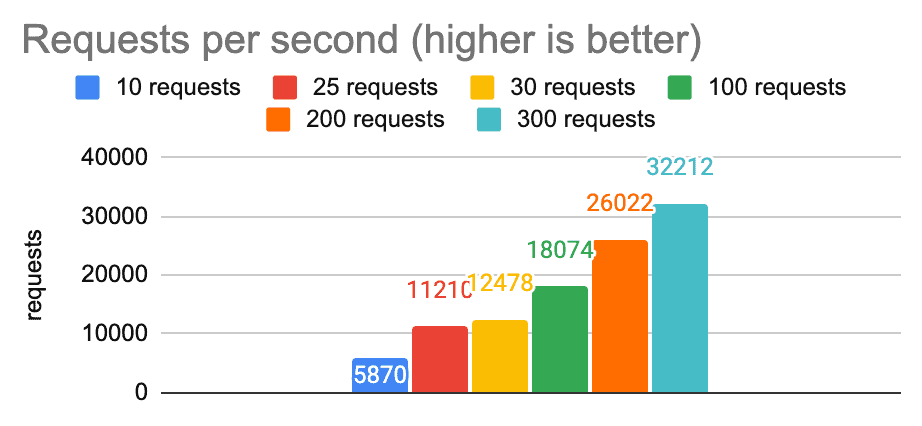
In-region throughput by concurrent requests (requests/s)
| Metric | 10 | 25 | 30 | 100 | 200 | 300 |
|---|---|---|---|---|---|---|
| Throughput | 5,870 | 11,210 | 12,478 | 18,074 | 26,022 | 32,212 |
Higher throughput is better. The load generator ran on one c6i.4xlarge instance in the same region as the service.
Compare the three client experiments carefully
For the 20 ms p99.9 goal, the series reported these single-process results:
- JavaScript: 8,300 requests per second
- Python with
uvloop: 9,100 requests per second - .NET: 26,000 requests per second
This was not an apples-to-apples language comparison. A JavaScript or Python process in those tests used one CPU core, while the C# process could use the instance’s 16 cores. The .NET result was about 2.5 times the Python result rather than scaling linearly with core count, which was consistent with our observation that the bottleneck moved away from CPU. The experiment did not isolate all other differences among the clients or load generators.
Defaults should carry the common complexity
The experiment gave us a basis for the original development and in-region defaults in the .NET SDK. We named the pre-built configuration families Configurations.Laptop, Configurations.InRegion.Default, and Configurations.InRegion.LowLatency. Custom configurations remained available for workloads that did not fit those starting points.
Current SDK note: Those configuration families still exist, but current code selects a version through methods such as
Configurations.Laptop.Latest()orConfigurations.Laptop.V1(). Their internal concurrency, timeout, and retry settings have changed since this benchmark. Use the current .NET SDK configuration source, not the 2022 measurements, for implementation decisions today.
The durable lesson is not that every .NET workload should use one concurrency value. It is that the client can absorb common connection and scheduling choices, while an application can select a different latency-throughput balance when its workload demands one.
To put that approach to work today, start with the current Momento .NET SDK quickstart.