
Consistency compounds: Valkey's journey to 200 Gbps
Across four releases, I/O-threading changes removed a serial copy bottleneck, cut p99 latency, and brought large GETs to line rate on our 200 Gbps test rig.
 Khawaja Shams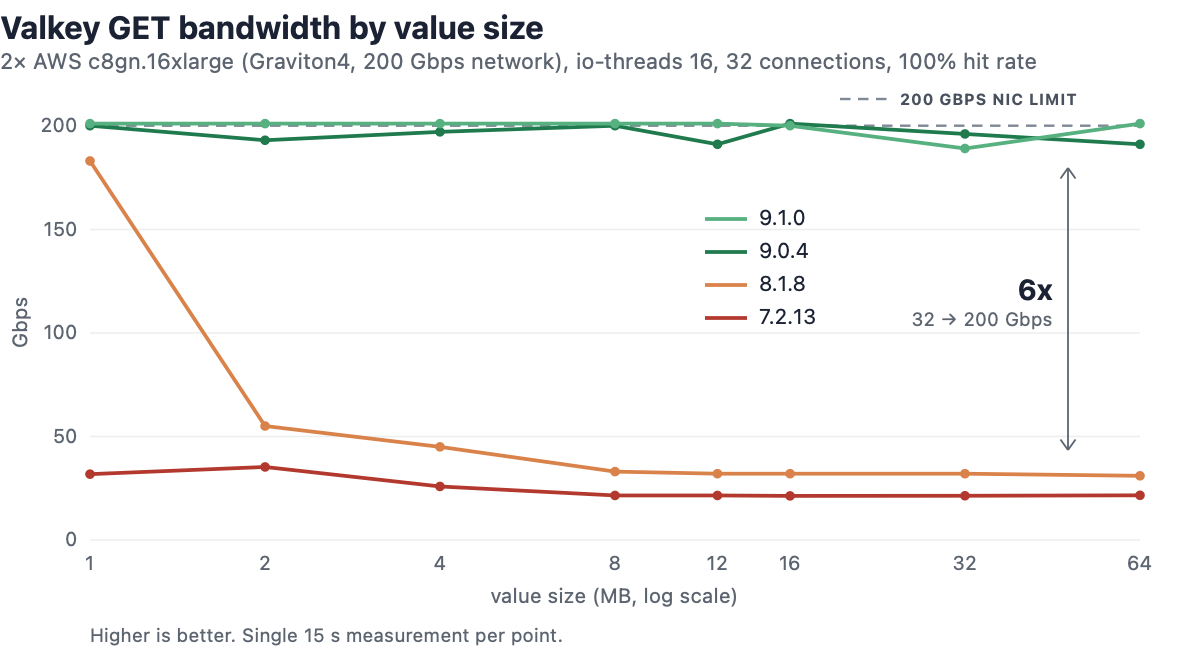
If you came here looking for a post from me on consistency models, I have to disappoint you. Today, I want to talk about the value of consistency in life. In life, effort is additive, but consistency is multiplicative.
Over the last few years, I have had the honor of watching the Valkey project blossom from an idea into an inspirational, community-driven effort with consistent improvements in each release. These improvements range from memory efficiency to availability at scale to substantial performance gains. These small improvements compound.
This compounding effect and the power of a driven community is perhaps best illustrated by the journey of the I/O-threading architecture and its impact on large objects from 1 MB to 64 MB in Valkey. Larger items are becoming increasingly important for inference KV caches, 4K video streaming, and other enticing use cases. At the very least, the impact of large objects should not be overlooked, as they can impact everyone else’s latency; this post measures how fast the large objects themselves go.
Buckle up, because it’s about to get spicy.
A brief history of I/O threads
Valkey 7.2 inherited an I/O-thread model from a software stack doing its best to stay single-threaded. The main thread and I/O threads worked in coordinated phases, separated by synchronization barriers, and the 7.2 config file is candid about the result: “Usually threading reads doesn’t help much.”
Valkey 8.0 delivered a fundamental rearchitecture of I/O threads, tripling throughput to over a million requests per second. This idea was not new. In August 2023, seven months before the fork, Dan Touitou filed redis#12489, laying out exactly this design in detail, benchmarks included.
Redis let #12489 sit. The issue is still open in the tracker today, unassigned and without a milestone.
Within days of the fork, the Valkey community copied the proposal verbatim into issue #22, greeted it as “a true gem,” and shipped it. The new architecture enabled continuously running I/O threads connected by queues, so reads, parses, and writes proceed on separate cores while the main thread executes commands. Valkey 8.1 delivered TLS handshake offload to I/O threads in #1338.
Redis shipped a strikingly similar asynchronous I/O-threading model in Redis 8 in May 2025, a year after the fork and 21 months after the design landed in its own tracker. Around the same time, we put Valkey 8.1 and Redis 8.0 head to head on small objects. Valkey 8.1 outran Redis 8.0 by 37% on writes and 16% on reads.
Valkey 9.0 brought reply copy avoidance, changing the performance of large items entirely. Before this change, the main thread copied the entire object into a connection reply buffer before moving to the next command. While a large item is being copied, the entire pipeline stalls. Small objects are not serviced until the copy finishes.
Valkey 9.0 instead passes a reference to the I/O threads and keeps the object alive with a reference count. The I/O worker for that connection hands the object’s memory directly to writev(). This shortens the handoff to the I/O threads and gets the main thread back to handling requests.
Valkey 9.1 then redesigned communication between the main thread and I/O threads around lock-free queues, credited in the release notes with an 8-17% throughput gain.
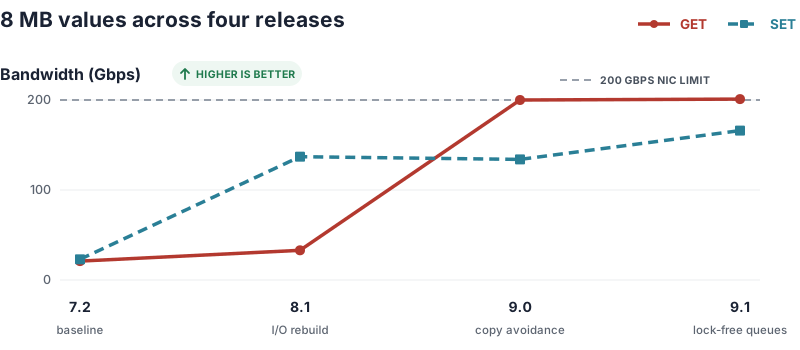
Based on these changes, we expected 8.0 to lift reads and writes for smaller items but still struggle to fill the network link for larger items. We expected 9.0 to bring GETs to line rate and 9.1 to improve writes.
This is what open-source competition buys everyone, including teams that never leave Redis. A performance design that sat for seven months as an unassigned issue became table stakes for both projects within two years of being filed.
Show me the numbers
We swept values from 1 MB to 64 MB across four Valkey releases on two nodes with 200 Gbps of bandwidth between them. The full setup is below.
Valkey 7.2: reads capped at 35 Gbps, writes at 55

An 8 MB value delivers 21 Gbps on reads and 23 Gbps on writes, with p99 latencies of 174 and 164 ms. Turning on io-threads-do-reads moved only the 1 MB read cell.
Valkey 8.0 and 8.1: writes take off, large reads stay put

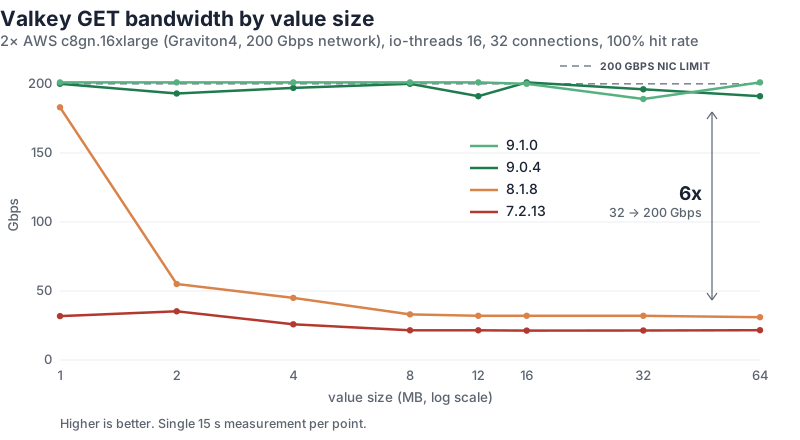
The threading rebuild lifts our 8 MB write from 23 to 137 Gbps, six times faster, and 1 MB reads reach 183 Gbps. Larger reads settle at 30-33 Gbps whether the value is 8 MB or 64 MB. That flat floor points to a serial, per-byte bottleneck. Valkey 8.0.9 and 8.1.8 measured the same at every size, so one line carries both.
Valkey 9.0: large GETs jump to line rate

Every size from 1 MB to 64 MB reads at 190-201 Gbps. The 8 MB p99 falls from 112 to 24 ms, and a 64 MB read drops from just under a second to 230 ms. Writes do not move because the ingest path was never copy-bound. That ceiling waits for 9.1.
Valkey 9.1: more headroom for writes

With reads pinned at the network limit, the gain surfaces on writes. The 8 MB write rises from 134 to 166 Gbps, a 24% gain, while values from 12 MB to 64 MB gain 11-19%.
The short run held
To make sure the 15-second runs were not catching a lucky window, I reran every 8 MB GET and SET cell for 15 minutes. Valkey 9.1 is a good example: GET held 200.8 Gbps and SET held 165.5 Gbps, right on top of the original 201 and 166 Gbps results. Nothing sagged as the runs went on.

Detailed results
Reads (GET)
GET-only, 32 connections, 100% hit rate.
GET bandwidth (Gbps)
| Value size | 7.2.13 | 8.1.8 | 9.0.4 |
|---|---|---|---|
| 1 MB | 32 | 183 | 200 |
| 2 MB | 35 | 55 | 193 |
| 4 MB | 26 | 45 | 197 |
| 8 MB | 21 | 33 | 200 |
| 12 MB | 21 | 32 | 191 |
| 16 MB | 21 | 32 | 201 |
| 32 MB | 21 | 32 | 196 |
| 64 MB | 22 | 31 | 191 |
Valkey 9.1 reads also hold line rate, so the table stops at 9.0.
GET p99 latency (ms)
| Value size | 7.2.13 | 8.1.8 | 9.0.4 |
|---|---|---|---|
| 1 MB | 13 | 2.2 | 2.4 |
| 2 MB | 20 | 19 | 5.1 |
| 4 MB | 58 | 41 | 9.4 |
| 8 MB | 174 | 112 | 24 |
| 12 MB | 244 | 166 | 56 |
| 16 MB | 329 | 238 | 56 |
| 32 MB | 531 | 489 | 116 |
| 64 MB | 948 | 1,020 | 230 |
Writes (SET)
SET-only, 32 connections.
SET bandwidth (Gbps)
| Value size | 7.2.13 | 8.1.8 | 9.0.4 | 9.1.0 |
|---|---|---|---|---|
| 1 MB | 51 | 201 | 201 | 201 |
| 2 MB | 53 | 200 | 200 | 201 |
| 4 MB | 55 | 200 | 200 | 201 |
| 8 MB | 23 | 137 | 134 | 166 |
| 12 MB | 23 | 135 | 139 | 166 |
| 16 MB | 24 | 137 | 139 | 165 |
| 32 MB | 24 | 139 | 134 | 159 |
| 64 MB | 24 | 130 | 134 | 149 |
SET p99 latency (ms)
| Value size | 7.2.13 | 8.1.8 | 9.0.4 | 9.1.0 |
|---|---|---|---|---|
| 1 MB | 8.7 | 3.3 | 3.2 | 3.2 |
| 2 MB | 17 | 6.5 | 6.7 | 5.3 |
| 4 MB | 35 | 12 | 13 | 14 |
| 8 MB | 164 | 41 | 49 | 34 |
| 12 MB | 289 | 62 | 57 | 52 |
| 16 MB | 357 | 77 | 70 | 60 |
| 32 MB | 1,580 | 118 | 143 | 107 |
| 64 MB | 2,580 | 237 | 213 | 206 |
The setup
Machines. Two c8gn.16xlarge instances with Graviton4 and 200 Gbps networking in the same availability zone and cluster placement group, running Amazon Linux 2023.
Server. We tested the official valkey/valkey Docker image at versions 7.2.13, 8.1.8, 9.0.4, and 9.1.0. We also measured 8.0.9. It matched 8.1.8 within run-to-run noise at every size, so the tables show 8.1 as the 8.x column. Valkey 7.2 ran with the same flags as the newer versions. A control with io-threads-do-reads yes changed only the 1 MB GET cell, from 32 to 41 Gbps. Each version ran in a fresh container with host networking:
docker run --network host --cpuset-cpus 8-23 \
  --ulimit nofile=32768:65536 valkey/valkey:<version> \
  --save '' --appendonly no --io-threads 16 \
  --protected-mode no --maxmemory 60gb
Persistence was off. The 16 threads in Valkey’s io-threads count were one main thread plus 15 I/O workers. The process was pinned to cores 8-23 so it never fought the kernel for the cores doing network interrupt work.
Interrupts. irqbalance was off on both machines. The ENA NIC was configured with four combined queues and their IRQs pinned to cores 0-3. Without this step, results wander from run to run as the kernel shuffles interrupts onto whatever cores the server or client threads happen to be using. If you benchmark at these speeds, pin your IRQs first and thank yourself later.
# Run on both machines. ens50 is the ENA interface name on these instances.
sudo systemctl stop irqbalance
sudo ethtool -L ens50 combined 4
i=0
for irq in $(grep ens50 /proc/interrupts | awk '{print $1}' | tr -d ':'); do
  echo $((i%4)) | sudo tee /proc/irq/$irq/smp_affinity_list > /dev/null
  i=$((i+1))
done
Client. We used valkey-lab, built on cachecannon, with 16 worker threads pinned to cores 4-19, 32 connections, and pipeline depth 1. Reads and writes were measured in separate passes. Read passes prefilled the keyspace and ran at a 100% hit rate. Each short-run cell was a 15-second measurement after a five-second warmup, over a 500-key keyspace with 16-byte keys.
We kept concurrency at 32 connections because AWS caps a single TCP flow at roughly 9.5 Gbps. We verified 9.53 Gbps with iperf3. Saturating a 200 Gbps NIC requires spreading the load across flows.
One invocation per cell, with -s swept across the value sizes:
# GET pass: prefill the 500-key keyspace, then measure at a 100% hit rate.
valkey-lab -h <server> -c 32 -P 1 -t 16 --cpu-list 4-19 \
  -n 500 -r 100:0 --prefill --warmup 5s -d 15s \
  -s <value_bytes> --key-size 16

# SET pass.
valkey-lab -h <server> -c 32 -P 1 -t 16 --cpu-list 4-19 \
  -n 500 -r 0:100 --warmup 5s -d 15s \
  -s <value_bytes> --key-size 16
Scope of the result. This is a single-node, no-TLS, persistence-disabled test with 32 closed-loop connections, pipeline depth 1, and a 100% hit rate. Most table cells are one 15-second measurement after warmup. The results describe this rig and workload. Broader production claims need repeated runs and additional configurations.
We benchmarked whole releases rather than individual changes, so we treat the pull requests named in this post as leading explanations rather than proof of causality.
What this means if you run Valkey
Valkey 9.x delivers roughly 6x the 64 MB read bandwidth of 8.x while cutting p99 from just under a second to about 230 ms on this single-node, no-TLS test. Our earlier mixed-workload test also found far less collateral latency for small requests when a large read arrived.
The practical takeaway is narrower than “Valkey is always faster.” Valkey 8.1 is essentially flat on this workload, Valkey 9.0 changes the large-GET path, and Valkey 9.1 improves large SETs on this rig. If large values matter to your workload, test 9.x with your object-size distribution, concurrency, TLS, and persistence settings rather than extrapolating from a small-object benchmark, or from this one.
Valkey has consistently improved performance, memory efficiency, and availability at scale. Each version brings about a new set of improvements driven by issues faced by real users in production. A vibrant community where nobody is incentivized to withhold features for the sake of revenue and everyone is incentivized to chase continuous improvement is what makes Valkey truly special. Effort is additive. Consistency is multiplicative.
Serving megabyte-sized objects at wire speed is what I’ve been spending a lot of time on lately. If you are wrangling larger objects, let’s talk. Join me on Valkey Slack.