Most large-scale systems don’t fail because of a single bad decision. They fail because a set of reasonable decisions start interacting in ways no one had to think about early on.
Distributed caches are no different. At small scale, the system is simple, predictable, and easy to reason about. Clients connect to a cluster, data flows where it should, and maintaining those connections is effectively invisible.
As systems grow, those design decisions are still there, but maintaining connections becomes increasingly more important. The cluster isn’t doing anything wrong. Neither are the clients. The shape of the system just changes as scale increases.
The NxM problem lives in that growing pain. It’s not obvious, it isn’t new, and it rarely shows up until a system has been working well for quite some time.
How the NxM problem grows
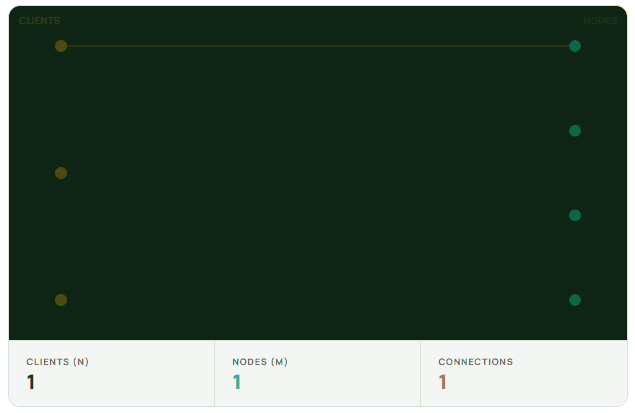
The NxM problem is fundamentally about connection load. When N clients each open connections to M nodes in a cluster, the total number of connections grows as N×M. This multiplicative growth is what distinguishes it from typical scaling challenges, where connection counts tend to grow linearly.
In distributed cache architectures where clients connect directly to cluster nodes, like Redis and Valkey, each application instance is responsible for figuring out where data lives and talking to the correct nodes itself. That means clients are cluster-aware. They discover the cluster topology, understand how shards and replicas are laid out, and open direct TCP connections to the nodes they might need to talk to. In a fully-sharded cluster with replication, that means opening connections to every shard and every replica.
At small scale, this works well. It’s simple and efficient. But it also means every client fans out across the entire cluster.
If you have 50 shards with two replicas per shard, that’s 150 nodes including primaries. A single client maintains connections to all 150. With 1,000 application instances, you’re managing 150,000 concurrent connections. Nothing is broken yet, but the system is becoming sensitive to change.
The real trouble starts during scaling events. With modern infrastructure, scaling is routine. New application instances spin up cold, and each one immediately tries to establish its full set of connections. So scaling from 1,000 to 1,500 instances doesn’t add 500 connections — it adds 500 clients × 150 nodes, or 75,000 new connection attempts hitting the cluster at roughly the same time.
That’s a connection storm.
“When a Redis node slows down, thousands of clients may simultaneously close connections and create new ones. Those retries amplify load instead of relieving it, creating a feedback loop that can lead to outages.” – Shawn Wang, Uber Online Data Infrastructure Team, Real-World Caching Lessons from 1B RPS in Prod
Why connection storms stall your cache
Each new connection requires a TCP handshake, typically a TLS negotiation, authentication, and initial command processing. In Valkey, each node handles this work on a single-threaded event loop. During a storm, that loop spends more time accepting connections than serving requests.
A full TLS 1.3 handshake costs roughly 2–3ms of CPU time for certificate chain validation, ECDHE key exchange, and cipher negotiation. At 2ms per handshake across a wave of new connections — say 1,000 pod restarts each creating 20,000 new connections — you’re burning 40 CPU-seconds just on TLS establishment, spread unevenly across backend nodes.
From the outside, the cluster can look healthy. Nodes are up. Slots are balanced. But latency spikes, throughput drops, and existing clients begin timing out because the system is spending its cycles just keeping up with connection churn. The cache metrics look fine while the application fleet struggles to serve requests. This is where debugging becomes a nightmare.
What makes this especially hard to reason about is that nothing is misconfigured. Every client is behaving correctly. Every node is doing its job. The failure mode comes entirely from the multiplicative interaction between client count and node count. It’s a structural property of direct-connect architectures, not a bug.
Why your cache slows down during deployments
Imagine an e-commerce platform using Valkey as a shared cache for product data, pricing, inventory counts, and session state. The platform runs stateless application instances behind a load balancer, each with a Valkey client embedded directly in the request path.
The platform is running around 5,000 application instances across multiple regions. To keep latency low and throughput high, the Valkey cluster contains 1,500 cache nodes, with data sharded across the cluster.
Under steady-state conditions, everything works well. Hot keys are served efficiently, cache hit rates are high, and the system handles normal traffic spikes without issue.
Then capacity needs to be added ahead of a major promotion, which is a completely routine operation. Slots are rebalanced, and the cluster topology changes.
From the perspective of a single application instance, this is a non-event. The client refreshes its view of the cluster and opens a handful of new connections. But this doesn’t happen once. It happens 5,000 times, across every application instance, at roughly the same time.
The symptoms show up fast and in unexpected places. Application CPU spikes as thousands of clients parse topology updates and recalculate slot mappings simultaneously. Ephemeral port exhaustion hits when each instance tries to establish hundreds of new TCP connections at once. TLS handshakes queue up, becoming a bottleneck as cryptographic operations compete for CPU. In some cases, you’ll also see cascading failure where one region’s storm triggers connection thrashing in adjacent regions as clients retry and back off in waves.
Warning signs your cache has an NxM problem
The NxM problem is easier to handle when you see it coming, and there are a few ways to distinguish it from more familiar scaling issues before they surface as pages.
The first is client-side CPU that spikes during topology changes but doesn’t correlate with request volume. If your application instances are pegging CPU during a scaling event while your cache request rate is flat or low, you’re likely watching clients spend cycles on connection establishment and slot-map recalculation rather than serving traffic.
Watch also for connection establishment latency that grows faster than cluster size would suggest. In a healthy system, adding 10% more nodes should grow connection overhead proportionally. If it produces a 30% jump in observed latency during the next scaling event, the system is showing early NxM sensitivity. The blast radius of future topology changes is already growing.
What tends to confuse on-call engineers regularly is p99 latency that’s fine all day but suddenly degrades during a 2 AM deployment window when traffic is minimal. The cause is almost never the new code. It’s the fleet restarting, every pod cold-connecting to every cluster node simultaneously, the resulting handshake storm eating into the event loop while request volume sits at its daily low.
Finally, if a connection storm in one region triggers elevated latency or errors in another, you’re likely seeing connection churn propagate through shared infrastructure. The cache cluster is fine. The connection management overhead is not.
How large teams contain connection load
Teams operating at scale have found a few categories of mitigation, each with their own tradeoffs.
The most accessible starting point is staggered rollout practices. Moving slots in batches with delays between waves gives clients time to converge before the next topology change arrives. Pairing this with exponential backoff and jitter randomizes retry timing across the fleet, which prevents thundering herds when topology updates fail or time out. These approaches reduce the blast radius of individual events but don’t change the underlying O(N×M) connection structure — they just make it less likely to detonate all at once.
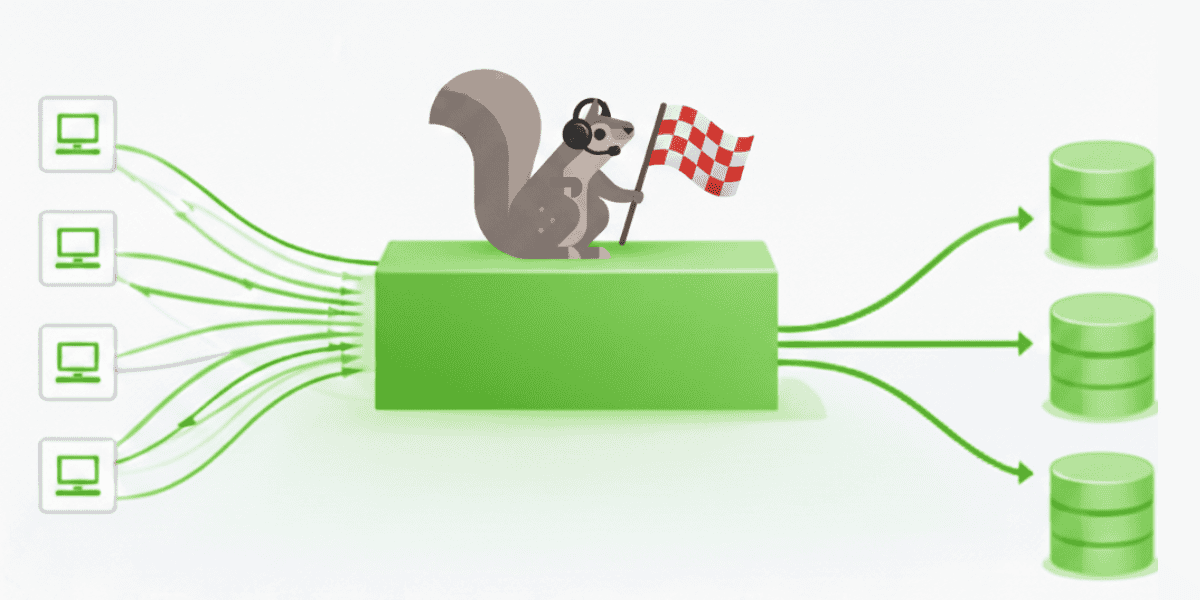
The more structural solution is introducing a connection pooling layer or routing proxy — something that aggregates client connections before they reach the cluster and shifts the connection math from O(N×M) toward O(N+M).

Clients connect to a smaller set of routers, and those routers maintain a stable, persistent pool of connections to the cluster. This is why Twitter built Twemproxy and Facebook built McRouter. They weren’t solving a caching problem. They were solving a connection management problem. Done well, the routing tier absorbs TLS handshakes once, reuses those connections for millions of requests, and prevents the backend from ever seeing deployment storms. Done poorly, it just moves the bottleneck one hop upstream. Implementation quality, specifically lock-free data structures, efficient serialization, and correct consistent hashing, is what makes the difference.
The third category is the least dramatic and often the most overlooked: treating connection count as a first-class capacity metric rather than an afterthought. Teams that get ahead of NxM problems monitor not just cache performance but client-side connection rates, metadata refresh frequency, and the estimated blast radius of topology changes. If a planned scaling event would double the number of connection attempts hitting the cluster in a 30-second window, that’s information worth having before the deployment starts, not after.
NxM is a sign your system has grown
The NxM problem isn’t a sign that a system is poorly designed. Quite the opposite. It’s a sign that a system has grown large enough for connection overhead to matter.
Direct-connect architectures are genuinely good at small and medium scale. The simplicity is a real advantage. Clients have full visibility into cluster topology, requests take the shortest possible path, and there’s no intermediary to reason about or operate. The cost of that simplicity is that it doesn’t do well as N and M grow independently.
None of the mitigations described above eliminate NxM — they just change where the complexity lives. Staggered rollouts shift complexity into deployment orchestration. Routing proxies shift complexity into the routing tier itself. Monitoring connection rates shifts complexity into capacity planning. The tradeoff is always between where you want to absorb the problem and what operational surface area you’re willing to own.
As Valkey continues to make larger clusters practical, this class of behavior will become more visible across real-world deployments. Clusters that would have plateaued at a few hundred nodes can now grow past a thousand. That’s good for memory capacity and throughput — but it multiplies the M in the NxM equation for every client in the fleet.
The right time to understand this problem is before the system is large enough to be hurt by it. Connection count needs to be part of your capacity planning model, not something discovered during a 3 AM incident when a routine topology change turns into a latency event. The math is quick and the behavior is predictable, which means teams that understand the shape of the problem can architect around it instead of reacting to it.
If you’ve operated systems where connection load became the binding constraint before memory or CPU, this should feel familiar. These are the kinds of failure modes that benefit most from shared operational knowledge. The debugging story is often the same: healthy metrics, struggling clients, and a root cause that only becomes obvious once you know what to look for.
Unlocked is a conference designed to make those conversations more visible. It is a place where practitioners compare notes on connection pressure, routing tradeoffs, and the architectural decisions that shape latency and reliability at scale. The next event takes place in Seattle this May for engineers working through these exact tradeoffs.