
More gRPC channels helped our JavaScript cache client under heavy load, so we expected them to help the Python client too. The measurements told us otherwise: in this 2022 experiment, one channel produced lower tail latency and higher throughput than two or five.
That surprise changed the tuning path. We kept one channel, found a useful concurrency range, and then tested whether uvloop could improve throughput in our asynchronous load generator. The result was a set of environment-specific defaults that made the client simpler to use without hiding the latency-throughput tradeoff.
This post is part of our series on the work behind a simple developer experience. The first post explains why a cache client should own this tuning, and the JavaScript investigation shows why its ideal settings were different.
Historical benchmark: These measurements and API names describe the client and service as they existed in 2022. The benchmark is not a current SDK comparison or a reproducible test plan: it does not record the SDK, Python, gRPC, or
uvloopversions; request and value shapes; run duration; repetitions; or complete laptop specifications. Consult the current Python SDK before making implementation decisions today.
Why Python needed its own tuning pass
The Python and JavaScript clients shared several constraints in this experiment:
- Both used gRPC, a framework for remote procedure calls, to communicate with the service.
- Both tests focused on one language process, where user-code execution could become CPU-bound.
- More concurrent requests meant more callbacks competing for CPU time.
- At the time, the service allowed 100 concurrent streams per channel, so requests above that limit could wait for connection capacity.
Those similarities gave us a starting hypothesis, not an answer. The Python gRPC implementation was largely written in C++, while the Node.js grpc-js implementation was written in JavaScript. Different runtimes and libraries could respond differently to the same channel and concurrency settings.
The charts report p50 and p99.9 latency. The p50 value is the median. The p99.9 value is the latency at or below which 99.9% of requests completed; the remaining 0.1% make up the slower tail.
Start with 5,000 requests on a laptop
We began with 5,000 concurrent requests from a laptop. This development-style environment had higher network latency than an application running near the service. With one channel and the 2022 limit of 100 concurrent streams, as many as 4,900 requests could wait in a backlog.
Extra channels made the result worse
The JavaScript experiment improved substantially when it moved to five channels. We tested one, two, and five channels in Python to see whether that result would carry over.
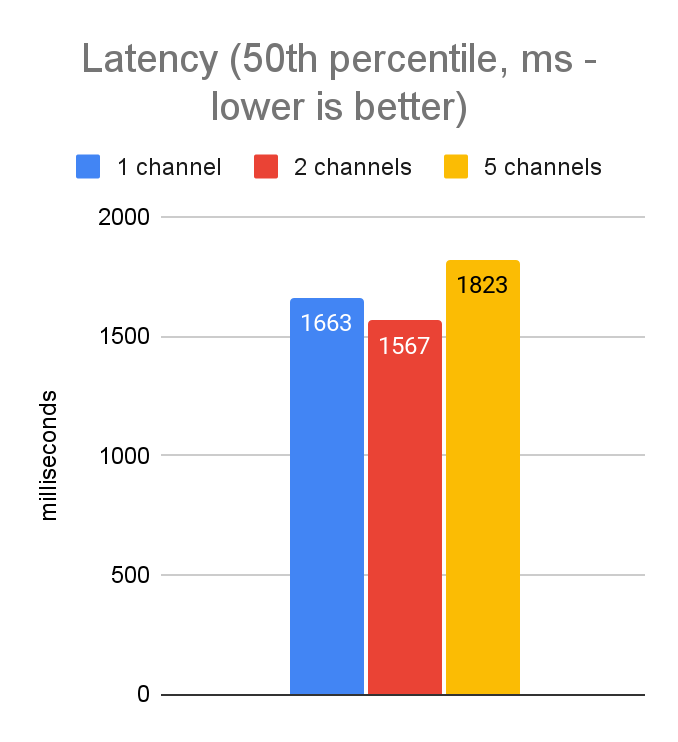
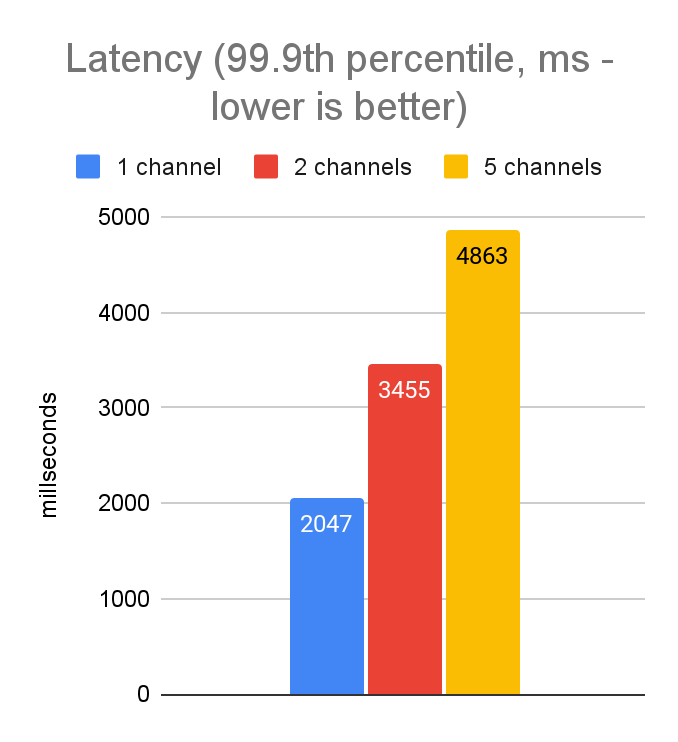
Laptop latency by channel count (ms)
| Percentile | 1 channel | 2 channels | 5 channels |
|---|---|---|---|
| p50 | 1,663 | 1,567 | 1,823 |
| p99.9 | 2,047 | 3,455 | 4,863 |
Lower latency is better. The test ran 5,000 concurrent requests from a laptop.
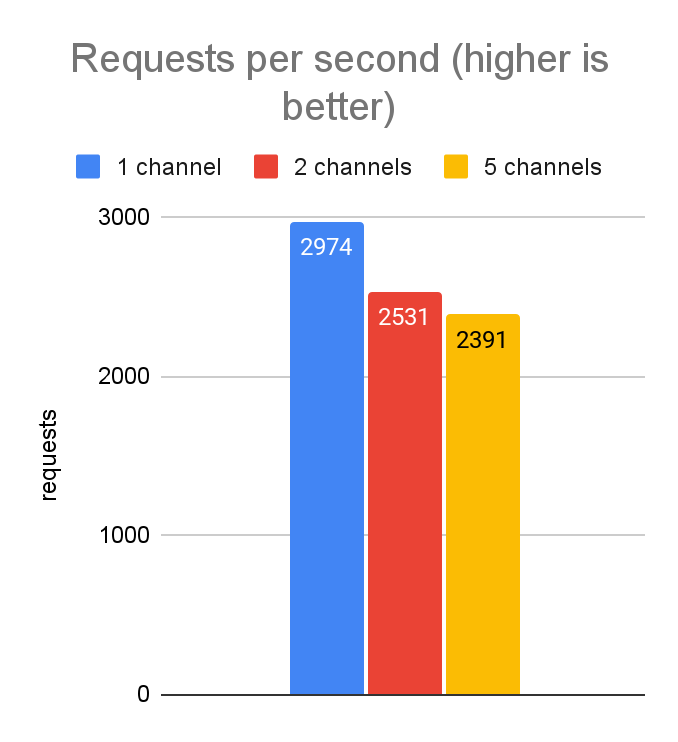
Laptop throughput by channel count (requests/s)
| Metric | 1 channel | 2 channels | 5 channels |
|---|---|---|---|
| Throughput | 2,974 | 2,531 | 2,391 |
Higher throughput is better. The test ran 5,000 concurrent requests from a laptop.
Unlike the JavaScript client, Python gained nothing from the extra channels in this test. One channel had both the lowest p99.9 latency and the highest throughput. The difference between the two gRPC implementations was our likely explanation, but this experiment did not isolate the cause.
The JavaScript test also depended on grpc.use_local_subchannel_pool when it used multiple channels. Changing that setting in the Python implementation did not move the measurements.
Concurrency was the useful lever
With the channel count fixed at one, we varied the maximum number of concurrent requests. The JavaScript experiment suggested that 50 to 100 might provide a useful latency-throughput balance, so we tested that range in Python.
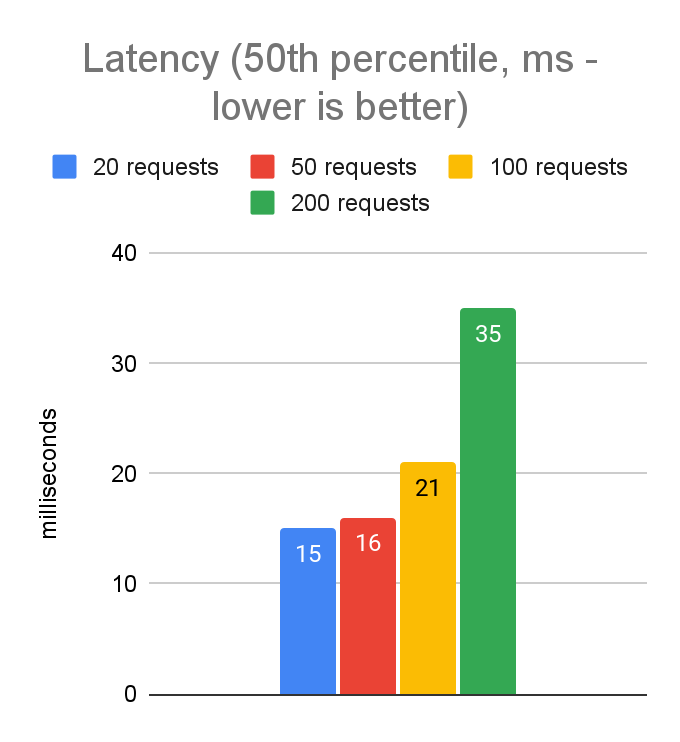
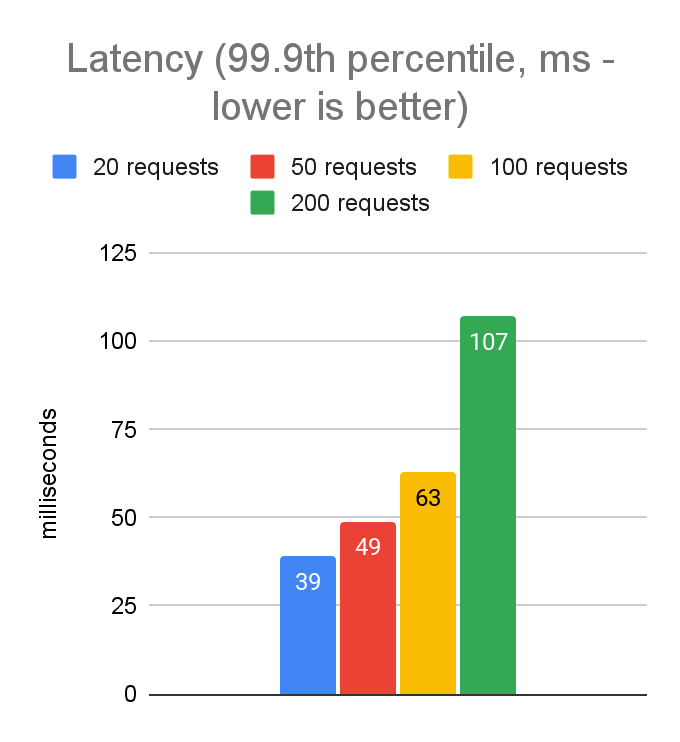
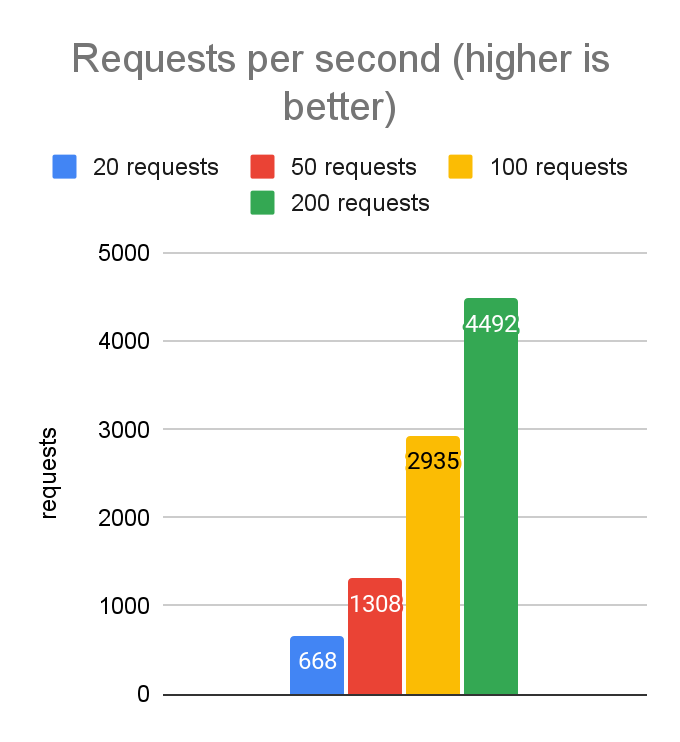
Laptop latency by concurrent requests (ms)
| Percentile | 20 | 50 | 100 | 200 |
|---|---|---|---|---|
| p50 | 15 | 16 | 21 | 35 |
| p99.9 | 39 | 49 | 63 | 107 |
Lower latency is better. The client used one gRPC channel.
Laptop throughput by concurrent requests (requests/s)
| Metric | 20 | 50 | 100 | 200 |
|---|---|---|---|---|
| Throughput | 668 | 1,308 | 2,935 | 4,492 |
Higher throughput is better. The client used one gRPC channel.
Moving from 50 to 100 concurrent requests increased throughput from 1,308 to 2,935 requests per second while p99.9 latency rose from 49 to 63 ms. We chose 100 as the starting point for the in-region test because it offered more throughput without the sharper tail-latency increase at 200.
Move the test in-region
The laptop test helped us expose client-side limits. Next, we moved the load generator to a c6i.4xlarge Amazon EC2 instance in the same region as the cache service. We had observed more consistent network performance from that instance class than from smaller instances, and removing most of the network distance let us focus on client overhead.
We used the same two latency targets as the JavaScript tuning work:
- p99.9 of 20 ms: a possible balance for applications that can tolerate more cache latency in exchange for throughput.
- p99.9 below 5 ms: a stricter target for applications where tail latency matters more than throughput.
These were goals for this experiment, not universal application requirements.
uvloop improved throughput
The test still focused on maximum performance from one Python process, so CPU time remained scarce. Much of the load generator’s work ran through Python’s asyncio library. We compared its default event loop with uvloop, which implements the event loop on top of the native libuv library.
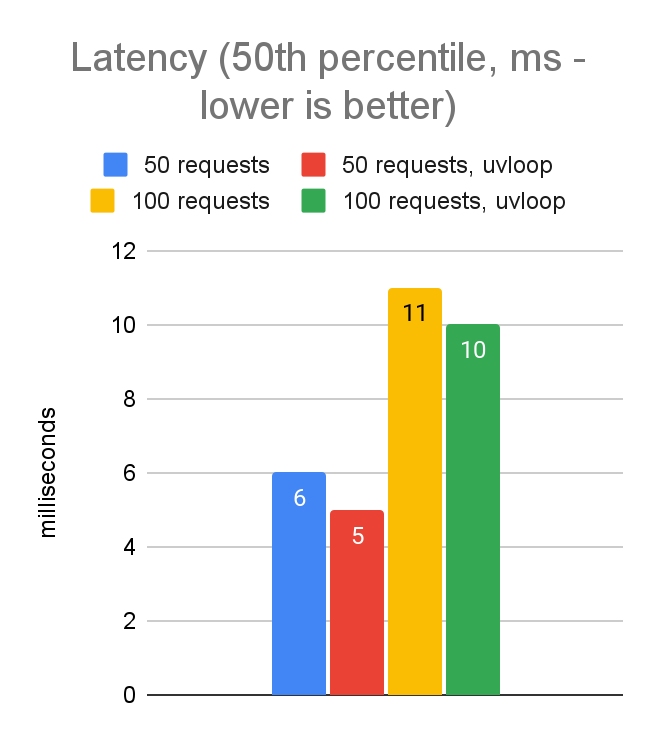
uvloop reduced p50 latency by 1 ms at both tested concurrency levels.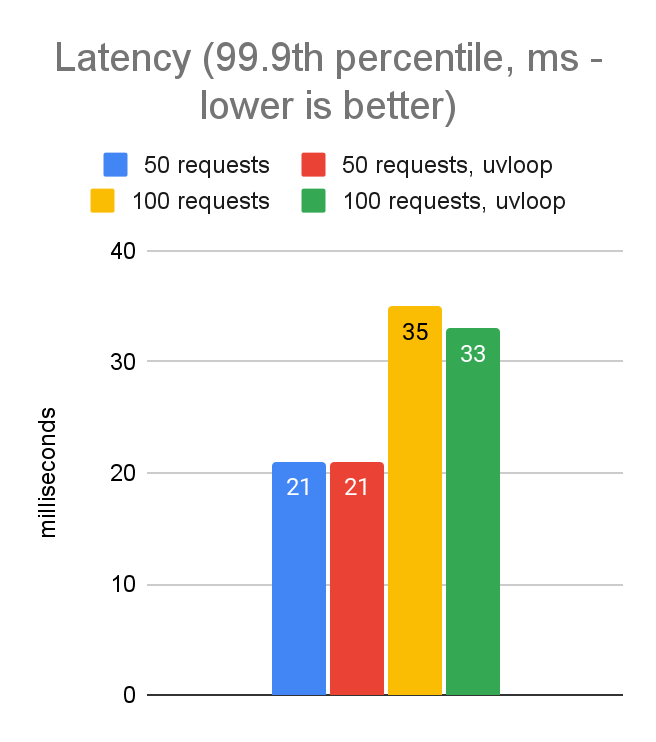
uvloop left p99.9 unchanged at 50 requests and reduced it by 2 ms at 100.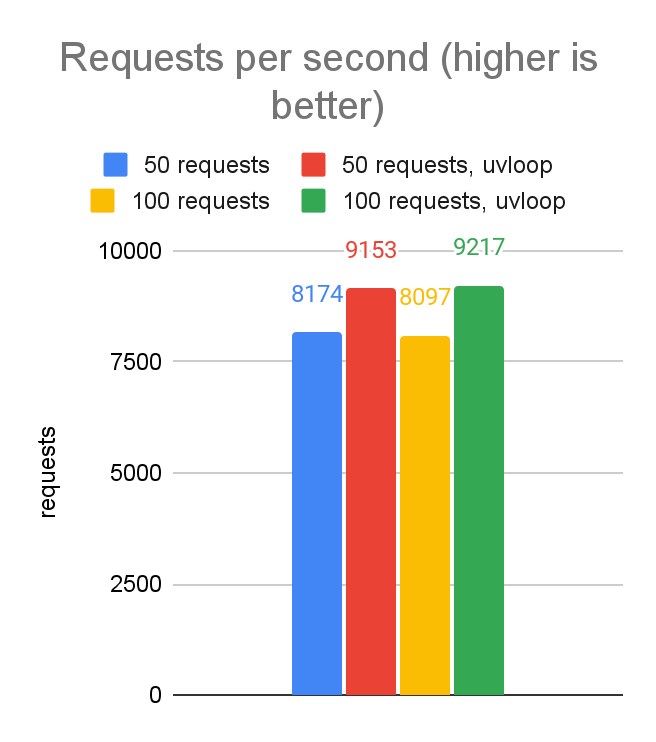
uvloop raised throughput from 8,174 to 9,153 requests per second at 50 requests and from 8,097 to 9,217 at 100.In-region latency with and without uvloop (ms)
| Percentile | 50, default | 50, uvloop | 100, default | 100, uvloop |
|---|---|---|---|---|
| p50 | 6 | 5 | 11 | 10 |
| p99.9 | 21 | 21 | 35 | 33 |
Lower latency is better. Column labels give the concurrent request count and event loop.
In-region throughput with and without uvloop (requests/s)
| Metric | 50, default | 50, uvloop | 100, default | 100, uvloop |
|---|---|---|---|---|
| Throughput | 8,174 | 9,153 | 8,097 | 9,217 |
Higher throughput is better. Column labels give the concurrent request count and event loop.
Switching to uvloop produced roughly a 10% throughput improvement in this comparison. It took only a two-line change in our load generator and brought the Python result close to where the JavaScript client had landed.
Choose latency or throughput with concurrency
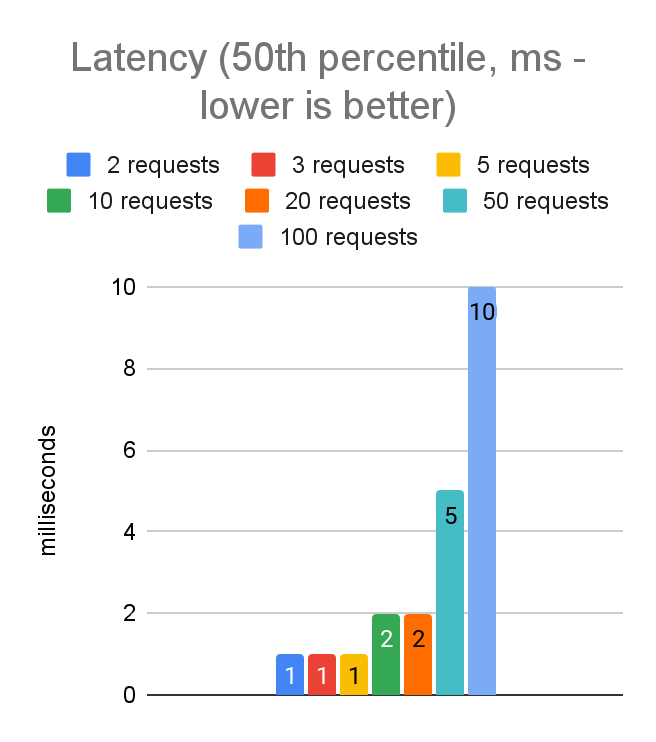
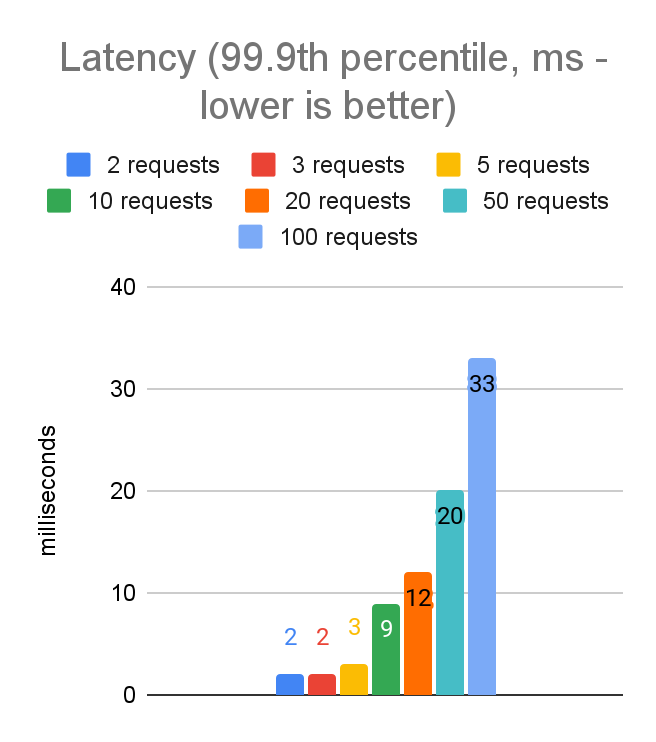
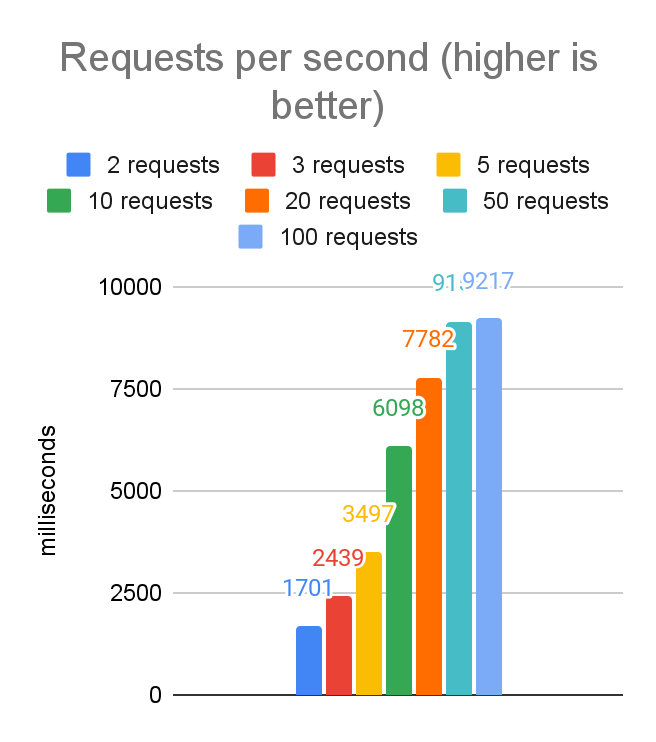
We kept uvloop enabled and swept the concurrency limit again. The resulting curve made the tradeoff explicit.
In-region latency by concurrent requests (ms)
| Percentile | 2 | 3 | 5 | 10 | 20 | 50 | 100 |
|---|---|---|---|---|---|---|---|
| p50 | 1 | 1 | 1 | 2 | 2 | 5 | 10 |
| p99.9 | 2 | 2 | 3 | 9 | 12 | 20 | 33 |
Lower latency is better. The load generator used uvloop on one c6i.4xlarge instance.
In-region throughput by concurrent requests (requests/s)
| Metric | 2 | 3 | 5 | 10 | 20 | 50 | 100 |
|---|---|---|---|---|---|---|---|
| Throughput | 1,701 | 2,439 | 3,497 | 6,098 | 7,782 | 9,192 | 9,217 |
Higher throughput is better. The load generator used uvloop on one c6i.4xlarge instance.
At 50 concurrent requests, p99.9 reached 20 ms while throughput reached 9,192 requests per second. At five requests, p99.9 fell to 3 ms and throughput fell to 3,497 requests per second. Neither setting was universally better; the right choice depended on whether the application valued more throughput or a tighter latency tail.
Running multiple Python processes could raise total machine throughput. This experiment deliberately stopped at one process, so it did not measure the costs or scaling behavior of that approach.
Defaults should carry the complexity
The experiment gave us a basis for the original development and in-region defaults in the Python client. At the time, we described the pre-built options as Configurations.Laptop, Configurations.InRegion, Configurations.InRegion.LowLatency, and ProdEnvironmentConfig. The exact APIs and settings belong to that 2022 release context, but the design goal remains the useful part: common environments should get a considered starting point, while specialized workloads can still tune the tradeoff themselves.
The next post in the series explores the .NET client, whose runtime can use multiple CPU cores without the same single-process constraint. If you are working in Python today, start with the current Python SDK and its configuration source.