

Pelikan sustained 340,000 operations per second (OPS) on a Google Cloud t2a-standard-16 VM before we tuned the system. Core pinning then pushed the same VM past 1 million OPS while keeping 99.9th-percentile (p999) client-side latency below our 2 ms service-level objective (SLO). We made no Pelikan code changes.
That result matters because the throughput a cache can sustain within its latency objective determines how well it can absorb hot keys and hot shards. It also affects how efficiently we can use each VM on behalf of our customers.
At the time of this test, Momento Cache was open core and built on Pelikan, the open source caching engine that summarized Twitter’s caching practices. Pelikan had production mileage at Twitter scale and contributions from research institutions. Its Rust rewrite added multiple workers, more data-plane and control-plane protocols, and strong TLS performance. We used the Rust implementation, which the project recommended for production.
We worked closely with the Twitter Pelikan team to tune the engine, its configuration, and its VM fit. This work supported our broader effort to deliver on Momento’s claim at the time that it was the world’s fastest cache.
This post follows our high-level look at Pelikan on Google Cloud’s Arm-based T2A VMs and applies the approach from 4 tips for building high-performance systems.
The two headline results were:
- Without tuning, one
t2a-standard-16VM sustained 340,000 OPS within the 2 ms p999 SLO. - With core pinning, the same VM exceeded 1 million OPS within that SLO. The technique produced similar gains on x86 architecture.
Build the benchmark around tail latency
Our goal was to maximize throughput without exceeding 2 ms p999 client-side latency. Tail latency was the constraint, not average latency.
We tested 260-byte items with 4-byte keys and 256-byte values. The workload used an 80:20 read/write ratio and 1,024 connections. Four t2a-standard-48 VMs running rpc-perf generated the traffic. We increased the load in 10,000-OPS steps until Pelikan breached the SLO.
Each server VM ran two Pelikan processes. Each process had five worker threads for I/O, request parsing, and related work, plus one dedicated storage thread for key-value access.
rpc-perf configuration
[general]
protocol = "memcache"
service = true
threads = 256
admin = "0.0.0.0:9090"

[target]
endpoints = [...] # list of IP:PORT for each endpoint

[request]
ratelimit = "2500" # rate was increased using admin port

[[keyspace]]
commands = [
  { verb = "get", weight = 8 }, # 80% read
  { verb = "set", weight = 2 }, # 20% write
]
length = 4 # 4-byte keys
values = [{ length = 256 }] # 256-byte values
Pelikan configuration
[admin]
host = "0.0.0.0"
port = "9999" # different port numbers were used for each instance

[server]
host = "0.0.0.0"
port = "12321" # different port numbers were used for each instance

[worker]
threads = 5

[seg]
hash_power = 24
heap_size = 25769803776
segment_size = 1048576
eviction = "Fifo"
Modern computer architecture can deliver many millions of DRAM accesses per second, per channel, for values of this size. That performance allowed us to pair several network I/O workers with each storage thread. Serializing memory access through the storage thread simplified the code, reduced the chance of data corruption, and largely eliminated data races.
Establish the untuned baseline
Without tuning, the t2a-standard-16 VM sustained 340,000 OPS within the 2 ms p999 SLO. The x86-based c2-standard-16 reached 460,000 OPS under the same objective. Those results gave us a baseline for systems tuning without code changes.
Turn context switching into testable hypotheses
Context switching is easier to feel than to see. Try reciting A through Z, then counting from 1 through 26. Alternating between the two tasks as A1, B2, C3, and so on takes longer because your attention keeps changing state. A processor also pays a cost when it switches between unrelated work, although a real VM faces much more nondeterminism than this analogy captures.
A distributed cache often spends much of its time in kernel space. In this workload, system calls fell into two broad categories: event handling and socket I/O. Socket I/O moved data into buffers while the kernel also processed packets, creating contention for memory access. Under high load, multiple threads or processes could add context-switching overhead. Core or CPU migration made that overhead worse.
Packet processing added another source of interruption. Soft interrupt (softirq) handlers ran in kernel space, outside the application’s view. The kernel threads had higher priority and could interrupt user-space threads so the system could handle incoming signals promptly.
From that mechanism, we formed three hypotheses:
- Isolating network threads on specific cores would reduce context switching and increase throughput. Dedicated cores should reduce unnecessary movement for both Pelikan and packet processing.
- Isolation would matter more at higher loads. With idle cores, the kernel could leave its own work and the cache’s user-space threads in place. Under contention, timely packet handling could force more expensive movement between cores.
- Tail latency would benefit more than p50 latency. Some requests would avoid interruptions even at high load, hiding the effect at the median. The interrupted requests would be more visible in the tail.
Separate application and network work by core
We used three steps to reduce involuntary context switches for Pelikan threads and packet processing:
- Map the VM’s core topology. We identified the number of physical CPUs, the CPU associated with each core, and the physical CPU handling network traffic. The
t2a-standard-16had one physical processor with 16 cores. This mapping was even more relevant for the C2 and T2D VM families. - Pin Pelikan threads to specific cores. Two Pelikan processes used six active threads each, for 12 total. We assigned each thread to a core. Network I/O remained the final source of interruptions that could repeatedly displace those threads.
- Pin receive/transmit queues to their own cores. The
t2a-standard-16network interface supported as many as 16 receive/transmit (RX/TX) queues, one per core, but booted with eight queues on the first eight cores. Four queue pairs were enough to keep our Pelikan threads above 95% utilization, so we pinned those pairs to four dedicated cores.
The final layout put 12 Pelikan threads on 12 cores and four RX/TX queue pairs on the other four. Network throughput and packet processing did not bottleneck the test, which gave us confidence that four queue pairs were enough.
Measure the effect on tail latency
Core pinning tripled the load the T2A VM could handle within the 2 ms p999 SLO. At 320,000 OPS, it reduced p999 latency by 50.8%. It also allowed the t2a-standard-16 to outperform the c2-standard-16.
We were still quantifying the precise role of context switching, but the throughput change gave us confidence in the core-pinning approach and supported our first hypothesis.
The gain increased with load, as the second hypothesis predicted. We measured a reduction of more than 23% at p999 under 200,000 OPS and more than 50% under 320,000 OPS.
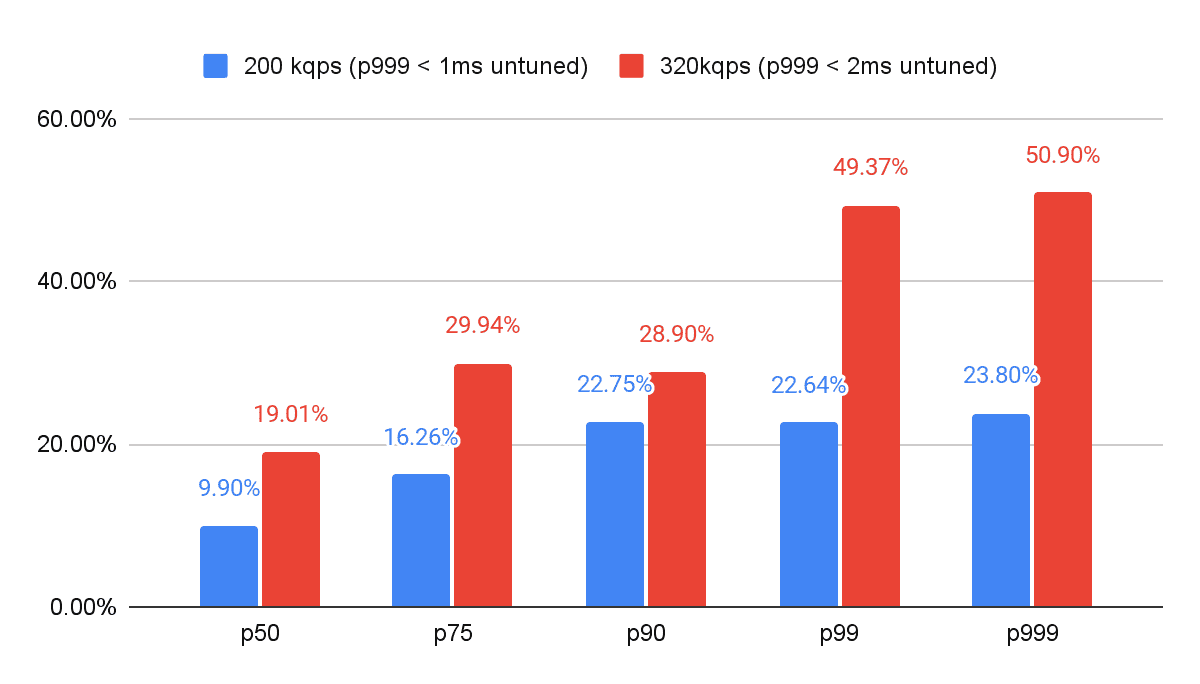
Median latency changed less. At 200,000 OPS, p50 latency fell by 10%. An optimization focused only on average or median latency could undervalue that result, while a tail-sensitive service benefited substantially at high load.
The same technique helped the x86-based C2 VM, although less dramatically. Within the 2 ms p999 SLO, core pinning improved throughput by 3× on the Arm-based T2A VM and 2.7× on the x86-based C2 VM.
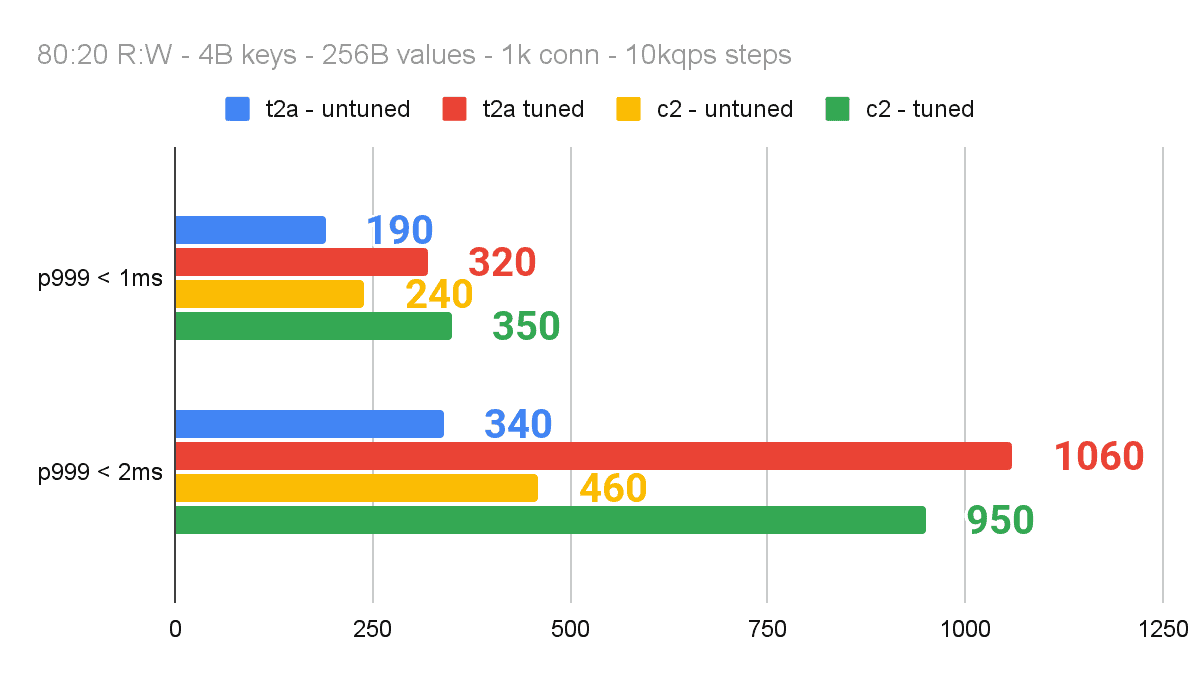
Before core pinning, C2 throughput was 35% higher than T2A throughput within the 2 ms objective: 460,000 versus 340,000 OPS. After we pinned both systems, T2A crossed 1 million OPS while C2 peaked at 950,000 OPS. For this workload and latency objective, core pinning changed which architecture led.
Keep the latency objective in view
The important result was not only higher throughput. Core pinning produced its largest gains where our SLO mattered most: p999 latency under heavy load. It also worked across the Arm and x86 systems we tested.
Our work with Google Cloud on these optimizations was an early step. We expected to keep tuning cost and performance for our customers.