
Why Large Payloads Break Caches at Scale
Valkey degradation at scale rarely traces back to a single oversized object. It traces back to traffic shape, event-loop pressure, and the absence of guardrails that respond to live system state. Lessons from Apple and Snap at Unlocked San Jose.
 Allen Helton
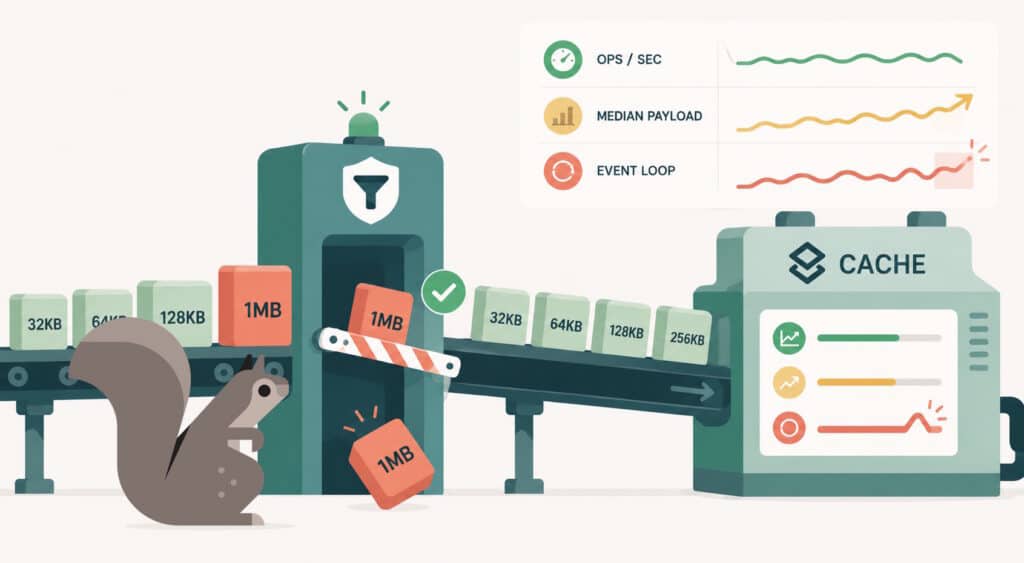
If you’re running Valkey in production, you’ve probably configured a payload limit somewhere and assumed it protects the cache from oversized objects. But cache failures at scale don’t happen because of a single giant payload. They come from thousands of requests arriving in the wrong shape at the wrong time.
For example, ping latency on a system run by Apple jumped from 300ms to over a second during a burst of large payloads. Input throughput on that instance climbed from 7.5 MB/s to 75 MB/s, and output from 29 MB/s to 185 MB/s. No single item was anywhere close to the default 512MB limit. But with a surge in medium-sized items, things started to crumble because the system’s request processing path was becoming saturated.
Valkey 9.0’s copy avoidance update addressed one failure mode on the read path. Cumulative payload volume, command shape, and write-path allocation pressure are separate sources of pressure that can still degrade cluster performance.
At Unlocked, Yiwen Zhang from Apple and Ovais Khan from Snap described production systems where payload size created pressure in different parts of their infrastructure. Both were describing things they had to build their way out of. Here’s what they shared, and where the guardrail logic actually needs to live.
The event loop bottleneck
Everything in Valkey runs through a single-threaded main event loop: reads, writes, command parsing, and reply construction all compete for execution time. To understand why large payloads cause the problems they do, you have to start here.
Yiwen’s framing was that Valkey latency is a result of how long the event loop stays busy and how long it gets blocked. When large payloads enter the picture, they add pressure to the event loop and reduce the time available for other work.
On the read path, the expensive operation for a large GET is reply construction. Before Valkey 9.0, that meant a full memory copy of the value into a reply buffer on the main thread before any I/O thread could take over. A 5MB GET meant a 5MB memcpy blocking the loop, which causes every other client to wait.
Valkey 9.0’s copy avoidance helps with this for several use cases (normal client, RAW encoding, object size above the 16KB or 64KB limit). The main thread writes a reference instead of copying the value, and I/O threads handle the transfer. This solves the most visible noisy-neighbor failure, where a handful of large GETs would block small ones on the main thread.
Valkey gives operators the ability to cap payload size for writes via proto-max-bulk-len. A large GET has no corresponding limit. A 10MB value (like a list that has grown over time) can be returned and contribute to event-loop pressure regardless of what write-side limits are configured.
Event-loop pressure can build gradually from many requests or spike because of a single outlier request. Enough large GETs arriving close together can cause serialization time to dominate the event loop. No individual request needs to be anywhere near the configured limit for the system to degrade.
Large SETs have a copy problem
In theory, Valkey can skip the allocation and copy on the way in. For payloads at or above 32KB, it can reuse the query buffer directly as the stored value, but the buffer must be aligned at offset zero, and it must contain exactly that value with nothing else. In pipelined workloads, the buffer will always have something else in it, resulting in most large SETs producing a full allocation and memcpy in the parse phase.
Valkey 8.0’s I/O threading helps with this problem. The parse-phase allocation and copy now run on I/O threads instead of the main thread. Yiwen’s measurement on 256KB SETs (128 clients, pipeline depth 4) showed event-loop time per cycle dropping from ~171 µs with one I/O thread to ~93 µs with four. Throughput stayed flat around 13.3k RPS, and p99 improved roughly 10% (67ms to 60ms). The main thread got its time back even with the copy still occurring.
Shape degrades before size does
Ovais described large batch MGET commands creating regressions at Snap, caused by how the commands interacted with Valkey’s cluster architecture regardless of individual value size.
Valkey’s MGET is slot-based. Each key maps to a hash slot, and in a cluster, slots live on specific nodes. A multi-key MGET that spans multiple slots cannot be served by a single node and returns a CROSSSLOT error. Clients have to crack the batch into per-slot sub-batches and reassemble the result.
KeyDB, a Redis fork backed by Snap, had a proprietary capability called Cross-Slot MGET: a single command could query all the data hosted on a given node regardless of which slots those keys belonged to. Some of Snap’s workloads relied on this for throughput. When they ported to Valkey, those workloads regressed. Snap ported Cross-Slot MGET to Valkey internally to restore parity and are working with upstream maintainers to bring it to the project.
The shape of a command affects system pressure in different ways than payload byte count. How many keys it touches, how those keys are distributed across slots, and how the cluster has to coordinate the response, all affect performance in different ways. At the scale Snap operates, serving hundreds of millions of commands per second, that distinction adds up quickly.
A RESP proxy in front of the cluster introduces an additional pressure point. One slow command can hold up others behind it in the pipeline. Snap mitigated head-of-line blocking by increasing connection count and limiting pipelining for critical use cases. The root issue is command shape. Large batch commands occupy proxy pipelines longer than smaller individual requests.
Even if you understand these pressure points, they are still hard to identify in production because existing metrics don’t capture how workloads change over time.
Payload drift is invisible
Valkey provides solid system-level metrics: bytes per second, operations per second, event-loop health, SLOWLOG, large request and large reply diagnostics. But continuous visibility into payload size distribution is missing. Throughput at 100MB/s looks identical whether that’s 100 operations at 1MB each or 20 operations at 5MB each. However, they have very different costs to the event loop.
Yiwen proposed adding two payload size bucketing metrics (request_payload_bytes_bucket and reply_payload_bytes_bucket) to Valkey’s existing metrics. Bucketing requests and replies by size ranges gives operators the ability to detect when traffic shape shifts. Median payload sizes can slowly increase across a workload over weeks with no alert firing.
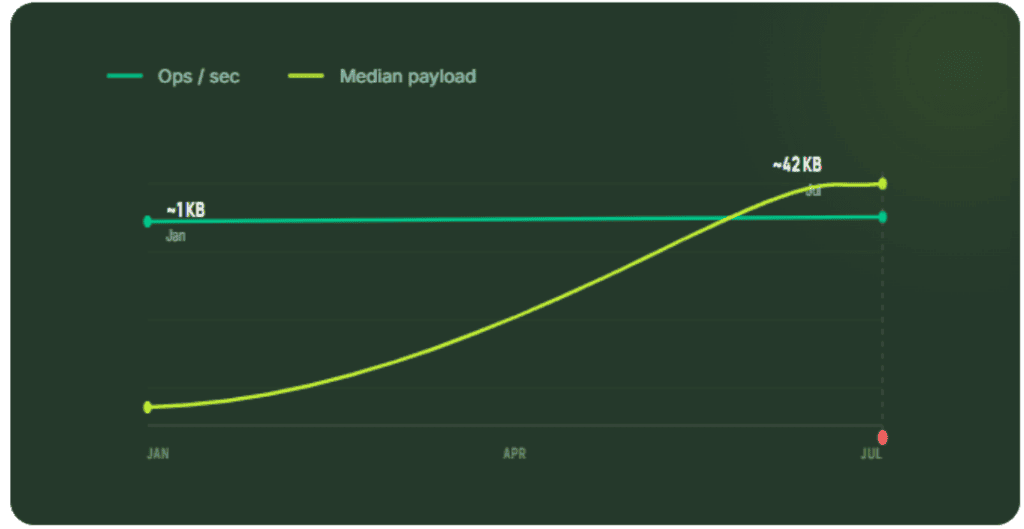
Runtime guardrails respond to distributions and trends, while static limits react to absolute values at the moment of ingestion. Avoiding payload drift requires both runtime guardrails and static limits.
Put guardrails above the engine
In Snap’s scenario, applications don’t connect directly to Valkey. They connect through a storage abstraction layer that connects to Valkey using a RESP proxy. This let them switch from KeyDB to Valkey without application teams being aware of the change. This architecture has allowed them to customize the system’s behavior, including partial MGET failure handling and zone-aware routing, without modifying application code.
Snap also added runtime guardrails inside the engine itself. They ported CPU throttling into their Valkey deployment so that when CPU utilization crosses 95%, write requests are throttled to preserve capacity for administrative commands. Protection activates based on what the system is experiencing. Something a byte-count threshold couldn’t do.
The proxy layer gave them a place to absorb large-payload problems like custom MGET handling, partial failure semantics, and connection count tuning to reduce head-of-line blocking. By moving these concerns into infrastructure, application teams no longer needed to own or implement them individually. Large-payload problems became contained to the infrastructure layer instead of every application’s codebase.
Ovais stated that strong abstractions turn risky migrations into operational exercises. The Snap migration peaked at around 30 caches per week through fully hands-off tooling. By the time of his talk, 70 to 80% of roughly 350 caches had moved, with application teams largely unaware it was happening. That’s what becomes possible when guardrails live above the engine.
Prioritize observability
The most practical step right now is adding payload size visibility to your cache observability stack, with the goal of catching payload drift. Aim to identify that the workload that had a 1KB median payload six months ago is now at 40KB, before it becomes a late-night latency incident.
Valkey 8.0 and 9.0 improved caching architecture meaningfully. I/O threading on the write path and copy avoidance on the read path both reduce event-loop pressure from large payloads. These alone change the performance curve. But knowing where your workload sits on that curve still requires instrumentation, and guardrails that respond to live system state still need to be built on top.
Payload limits are still important, but they’re increasingly becoming a first line of defence rather than the entire strategy. Modern cache systems need observability into traffic shape and guardrails that respond to changing conditions in real time.
Based on sessions by Yiwen Zhang (Apple) on large-payload guardrails and observability in Valkey, and Ovais Khan (Snap) on migrating 350+ cache clusters from KeyDB to Valkey. Watch the full replays at unlockedconf.io/san-jose-replays.