
At 3AM on a Tuesday, your Valkey cluster is at 60% memory utilization but nodes are pegged at 100% CPU. Query patterns look normal. Memory is fine. There’s no obvious hot key.
Then you notice something else: a deployment just rolled through your Kubernetes cluster.
Over the past few minutes, tens of thousands of application instances have reconnected. CPU profiles show SSL_do_handshake() and accept()dominating the hot path. Not request processing or command execution. TLS establishment.
The cache isn’t overloaded by traffic. It’s overloaded by connection churn.
Each new TLS 1.3 handshake costs several milliseconds of CPU time for certificate validation and key exchange. Multiply that by thousands of new connections during a rollout, and backend nodes briefly spend more time negotiating sessions than serving requests.
This is the NxM problem surfacing operationally. Once clusters reach a certain size, direct client-to-cluster architectures begin to show this limit.
Connection Collapse
With a routing layer, the total number of connections shifts from multiplicative growth to something much closer to linear. Backend cache nodes stop spending CPU time in accept() calls and TLS negotiation, and focus cycles on request processing where they belong.
In a typical deployment with 1,000 kubernetes pods and a 20-node cache cluster, direct connections create a massive overhead. Connection pools typically maintain multiple connections to each host – often 2-5 connections per pod per cache node for load balancing and fault isolation. With even conservative pooling (2 connections per host), you’re looking at 40,000 active connections across the cluster. Each connection consumes roughly 4KB of kernel memory for TCP buffers, plus application-level overhead for TLS state and connection tracking.
The real performance problem isn’t just the steady state though – it’s the connection churn. Any time pods are rescheduled due to deployments, auto-scaling events, or node maintenance, the cluster has to deal with a spike of brand new TLS handshakes. A full TLS handshake can cost milliseconds of CPU time per connection, depending on hardware, crypto acceleration, certificate chain depth, and whether session resumption is used. In a busy Kubernetes environment, this can mean thousands of handshakes per minute. If each restarting pod maintains ~20 TLS connections across the cluster, 1,000 pod restarts can create ~20,000 new handshakes. At a few milliseconds of CPU per handshake, that translates to tens of CPU-seconds spent purely on TLS establishment, spread unevenly across backend nodes. This is where cache nodes start spending 30-40% of their CPU on infrastructure overhead instead of serving requests.
With a routing layer, the topology transforms completely. The routing layer itself can be meaningfully bigger than the number of client pods – precisely because its job is to multiplex many connections together. A routing layer of 50 nodes serving 1,000 client pods creates 2,000-5,000 client connections (to the routers) and only 1,000-2,500 backend connections (routers to cache nodes, with 2-5 connections per routing node per cache node).
The connection state overhead drops by an order of magnitude, but more importantly, the CPU profile changes. Backend nodes that were previously spending 30-40% of cycles on connection management now spend 95%+ on request processing. The rate of TLS handshakes becomes decoupled from client-side deployment activity. When pods restart, they reconnect to long-lived routing nodes. The backend cluster never sees the storm. Routing nodes absorb the handshake cost once, then maintain persistent connections to backends that can be reused for millions of requests.
This shift shows up clearly in profiling data. In direct-connect deployments, SSL_do_handshake() and accept() often dominate backend CPU profiles during deployment churn. With routing layers, those symbols largely drop out of backend hot paths and become tied to routing-tier activity instead.
This idea has been around for a long time, but implementation quality varies dramatically. Twitter built Twemproxy to shield Memcached clusters from connection storms – a thin proxy focused primarily on connection pooling. Facebook built McRouter with more sophisticated routing logic and some caching capabilities to manage connection pressure at massive scale. Both systems were created to push connection overhead complexity out of the cache nodes to make them easier to operate.
These systems proved the value of the routing layer pattern, but they also revealed its complexity. Getting routing layer performance right requires deep systems expertise – understanding not just the theory but the implementation details that make the difference between a routing layer that helps and one that hurts. Lock contention in hash table lookups, CPU cache misses in serialization paths, memory allocation patterns that trigger GC pauses – these show up in production at scale, and they require careful engineering to avoid.
But collapsing connections is only the first-order effect. What a routing layer does beyond that is where architectural choices really make a difference.
The Limits of Thin Routing
The database world learned this lesson first. PgBouncer is the gold standard for PostgreSQL connection pooling – lightweight, battle-tested, and focused solely on multiplexing connections. It does one thing exceptionally well: collapse the NxM connection problem so databases spend cycles on queries instead of socket management.
That focus is what makes PgBouncer so successful. It doesn’t try to be a query optimizer or an application cache. It exists to manage connection pressure predictably and efficiently, and for many workloads that’s exactly what’s needed.
Traditional routing layers in cache systems often follow the same philosophy. They accept requests, determine where those requests should go, forward them, and return responses. They’re designed to be predictable and fast, deliberately avoiding state or decisions that complicate failure modes. That simplicity is a feature! It keeps routers easy to scale and reason about, and for many deployments it’s enough to eliminate the worst connection behavior.
Even with this type of connection aggregation in place, all request traffic still passes straight through to the backend cluster. Cache misses, retries, and bursts caused by hot keys are forwarded unchanged. A GET request arrives at the router, gets hashed to determine the target node, gets forwarded, waits for the response, and returns it to the client.
Consider what happens with a hot key. If a single key receives 1M requests per second, those 1M requests still hit the backend – though the distribution depends on your cluster configuration. In a replicated cluster where clients can perform eventually consistent reads, the load divides across the number of replicas. With 5 replicas, each node handles roughly 200,000 requests for that key. Without replication, all 1M requests concentrate on a single node.
Either way, the routing layer has aggregated connections, but it hasn’t fundamentally changed the request distribution. That backend node (or those replica nodes) still process hundreds of thousands of GET operations per second. At this scale, even well-optimized caches start showing pathological behavior. Lock contention on the hash table bucket, CPU cache line bouncing on LRU metadata updates, and mutex waits on access counters all show up in perf profiles. A single hot key can push lock wait time into the double digits of CPU time, degrading performance for neighboring keys that hash to the same regions.
The routing layer protects the cluster from connection overload, but it doesn’t reduce request pressure. It changes how load arrives without changing how much arrives.
The latency cost compounds the problem. Every request pays for an additional network hop. In a well-configured deployment, that can add sub-millisecond to a few milliseconds of additional latency depending on topology, serialization, and co-location. In some deployments, this can meaningfully increase per-request latency compared to direct backend access. For operations that were already at the p99 tail (5-10ms due to GC pauses or CPU contention), adding a routing hop can push you past SLA boundaries.
The performance engineering reality is that thin routing layers trade throughput for latency. You’ve eliminated connection overhead at the backend, but you’ve added a hop to every single request. For workloads where p50 latency is more important than p99, or where backend CPU was genuinely constrained by connection management, this is a good trade. For latency-sensitive workloads already running close to SLA limits, it’s not.
Now the routing layer itself becomes part of the hot path. Traffic patterns that were already problematic are now simply concentrated behind a smaller number of ingress points. The failure mode has simply moved, not been removed.
Routing as a Cache Tier
This pattern might feel familiar. CDNs went through the same evolution. Early edge layers forwarded requests to origin servers, but forwarding alone didn’t change the shape of load enough to matter. The breakthrough came when edge infrastructure started absorbing traffic, not just routing it. Caching at the edge meant origins could be optimized for write throughput and durability rather than read latency and request volume.
Momento’s routing layer applies that lesson directly to cache infrastructure. Rather than acting only as a passive proxy, the Momento routing tier actively participates in the data path. Frequently accessed keys are cached directly at the routing layer itself, which means a large portion of read traffic never reaches the backend cache cluster at all.
Each routing node maintains an in-memory cache specifically for hot data. These nodes cache the hottest keys passing through them, diverting load that would have otherwise been passed on to the cache nodes. The performance impact is measurable: backend request volume can drop by a large majority when hot reads are absorbed at the routing layer.
Cached items have a short, configurable TTL. This short expiration window ensures stale data doesn’t persist long in the routing layer, even without explicit invalidation. After the TTL expires, the entry expires and the next request fetches fresh data from the backend.
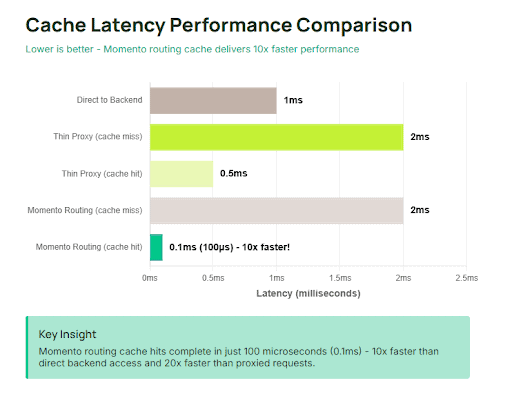
The latency characteristics change fundamentally. A routing cache hit completes in roughly 100 microseconds (0.1ms) – pure in-memory access with optimized serialization paths. Compare that to the 1.5-2ms for a proxied request that has to traverse to the backend and return, or even the sub-millisecond direct backend access. For the majority of requests, adding the routing layer actually reduces observed latency by an order of magnitude.
This latency improvement shows up across the distribution, not just at the median. P99 latency often improves more than p50 because the routing cache absorbs exactly the requests that were causing backend contention – hot keys that trigger lock waits and CPU cache line thrashing. When those requests are served from routing cache instead at 100μs, backend p99 latencies drop because the pathological access patterns have been filtered out.
Cache Consistency
You might be asking, “what happens when a key is updated?” If routing nodes are caching data, how do you maintain consistency?
Writes can arrive at different routing nodes. If a client writes through router A and then reads through router B, router B might still have a stale cached copy. This is handled by hashing in the backend. Routing caches rely primarily on short TTLs and invalidation mechanisms to limit staleness. Because writes can arrive through different routing nodes, brief inconsistency is possible, which follows suit with normal cache semantics.
For most cache workloads, this level of consistency is sufficient. Caches are not strongly consistent systems by design. Even without a routing layer, clients might see stale data due to replication lag or their own local caching. The routing layer’s consistency model matches the semantics clients already expect from a cache – writes are immediately visible to the writer, and eventually visible to all readers.
For workloads that require stronger guarantees, Momento provides a ReadConcern parameter configured at client initialization. When set to Consistent all requests from that client bypass the routing cache entirely and always read from the backend storage layer. This bypasses the routing cache and reads directly from the backend, providing stronger read freshness. Most workloads use the default Balanced mode, which leverages routing cache for performance, but applications with strict consistency requirements can configure their clients for consistent reads.
Handling Hot Keys
Hot keys are where the routing tier’s impact on predictability becomes most visible. Consider a configuration value read on every service startup or a feature flag checked on each request. Without an edge cache, these keys concentrate load on a small number of backend replicas and show up as lock contention and CPU spikes.
With a routing cache in place, access patterns change from concentrated to absorbed. The backend might see a single request while thousands are served from memory at the edge. The practical effect shows up immediately in tooling: perf top output that previously listed pthread_mutex_lock or hash-table contention among the top symbols often drops out of view entirely. Backend CPU usage falls back to baseline, and more importantly, latency variance flattens. The time to read the key becomes largely independent of how many clients are requesting it.
The routing tier also coalesces concurrent cache misses. When many requests arrive simultaneously for an uncached key, only one is forwarded while the others wait and share the result. This prevents “thundering herd” spikes where an expiration or deploy event briefly floods the backend with duplicate work and pushes p99 latency outside SLA boundaries.
Policy at the Edge
Beyond connection management and hot-read absorption, routing layers also create a centralized enforcement point for access control.
When clients connect directly to a cache cluster, authorization logic either lives in every client or is pushed down into the cache nodes themselves. Both approaches scale poorly. Client-side enforcement becomes difficult to audit and keep consistent. Node-level enforcement adds overhead directly to the hottest part of the system.
A routing layer creates a natural enforcement point. Fine-grained access control can be evaluated once, before a request reaches backend infrastructure.
At Momento, each request carries an authentication token. The routing layer validates this token (checking signature, expiration, and revocation status) and extracts the associated permissions. Permissions are cache-scoped and operation-specific – a token might allow read and write on cache prod-cache-1 but only read on prod-cache-2.
Authorization checks happen after authentication and before routing. If a request is denied, it never consumes backend resources. This is important for protecting against misconfigured clients or malicious traffic. A client attempting to read keys it doesn’t have access to gets rejected at the routing layer without touching backend cache nodes.
The Tradeoffs
Introducing a routing layer adds another tier to operate, monitor, and scale. If that layer is stateful, it requires careful handling of eviction, failure recovery, and observability. The performance characteristics also change in ways that require understanding, not just at the median but across the entire latency distribution.
Operational Complexity
Each routing node needs monitoring for cache hit rate, memory usage, CPU utilization, and request latency – but more importantly, you need to understand the distribution of these metrics. Low hit rates indicate the cache isn’t sized correctly or the workload isn’t cache-friendly. High memory usage might mean large values are getting cached when they shouldn’t be. CPU spikes could indicate hot key concentration or expensive authorization checks.
But the critical metric is hit rate variability across nodes. In a well-balanced routing tier, hit rates should be within 5-10% across all nodes. Wide variance (some nodes at 80% hit rate, others at 30%) indicates uneven load distribution or consistent hashing problems that will create performance hot spots.
Memory Overhead
The routing cache consumes memory that could otherwise be used for backend storage. If routing nodes use 10-20% of backend capacity, that means the total cluster memory footprint must account for it. For deployments where memory cost is a primary concern, this overhead needs justification through reduced backend load or improved latency.
The sizing decision depends on workload characteristics. Read-heavy workloads with significant key reuse benefit enormously from routing caches and can justify larger routing cache sizes. Write-heavy workloads see less benefit and might run with smaller routing caches or even disable caching entirely for specific caches.
Consistency Tradeoffs
The invalidation-based consistency model means there’s a window where different routing nodes might serve different versions of the same key. For most cache use cases, this is acceptable as caches trade consistency for performance. But applications that need strong consistency should understand this behavior and either avoid caching those keys at the routing layer or use additional coordination.
Latency Considerations
While routing-layer caching reduces latency for cache hits, it adds latency for cache misses and write operations. A cache miss now requires two hops: client → router → backend → router → client. Each hop adds serialization/deserialization overhead plus network transit time.
This additional hop affects cache misses and write operations as well. A write that would have completed in 1.5ms direct-to-backend now takes 2.5-3ms through the routing layer. For read-heavy workloads with high hit rates, the overall latency profile improves dramatically because most operations complete in 100 microseconds instead of milliseconds.
The crossover point depends on workload characteristics, especially routing cache hit rate and the latency difference between routed and direct backend requests. Routing cache hits complete far faster than backend accesses, while cache misses pay an additional hop through the routing layer.
As hit rates increase, average latency improves because more requests are served directly from memory at the routing tier. Workloads with strong temporal locality or frequently accessed keys often see substantial latency reductions, while uniformly distributed workloads may see smaller gains. The practical impact is best measured under real production traffic rather than inferred from theoretical averages.
Performance-focused teams should measure this empirically for their workload. The theoretical calculation matters less than observed latency under production traffic patterns. Some workloads have request patterns (strong temporal locality, high key reuse) where routing cache hit rates exceed 90%, making the latency improvement dramatic. Others (uniform key access, low reuse) see 20-30% hit rates and may still experience net latency improvement due to the 100μs cache hit performance.
What Belongs in the Routing Layer?
Once systems reach a certain size, some form of routing layer becomes a performance necessity. The question isn’t whether or not you should put something in the middle. It’s what responsibilities you ask that layer to take on, and how well those choices are implemented.
Should it only collapse connections, or should it also absorb hot traffic? Should it simply forward requests, or should it enforce policy and protect backend systems from misuse? And critically – if it caches data, how do you ensure the cache itself doesn’t become a bottleneck?
The thin routing approach (request forwarding with connection pooling) makes sense when connection overhead is the primary bottleneck and backend clusters can handle the full request load. It’s simpler to operate, has a smaller failure surface, and adds minimal latency. But it doesn’t solve hot key problems, doesn’t reduce backend request volume, and still requires backends to be sized for peak request rates.
The stateful routing approach (caching at the routing layer) makes sense when request distribution is the bottleneck – hot keys creating lock contention, bursty traffic causing CPU spikes, or high read-to-write ratios where the same data is accessed repeatedly. It requires more careful capacity planning and monitoring, but it fundamentally changes how load arrives at the backend. Done well, it can reduce backend request volume by 70-90% while simultaneously improving latency.
The critical distinction is implementation quality. It’s not enough to put a cache in the routing layer – it needs to be fast (lock-free data structures, CPU-efficient serialization), smart (TTL-based invalidation, request coalescing, consistent hashing), and observable (hit rate metrics, latency distributions, eviction rates). The design choices baked into the routing layer determine whether it meaningfully reduces system stress or just moves bottlenecks around. At scale, that distinction is often the difference between a system that maintains sub-millisecond latencies under growth and one where p99 keeps degrading despite adding capacity.
Why Momento Built This Into the Platform
Very few teams have the expertise (or the time) to build and tune all of this correctly. Collapsing connections, absorbing hot reads, enforcing policy, and operating a stateful routing tier require deep performance engineering knowledge. It means understanding CPU profiles and lock contention, TLS handshake costs during deployment churn, cache eviction behavior under uneven access patterns, and how cold-start effects ripple through latency distributions. It also means building the observability to see those patterns clearly, because routing performance is defined by tail latency and variance, not averages.
Momento’s routing layer exists to remove that burden. Instead of every team designing their own connection multiplexers, hot-key detection logic, and cache consistency strategies, these behaviors are implemented as part of the platform itself, informed by patterns observed across thousands of production workloads.
The routing tier collapses connections using a hub-and-spoke model, decoupling application deployment activity from backend connection pressure. It actively participates in reads, absorbing hot traffic before it reaches backend nodes. It also serves as a centralized enforcement point for access control, protecting backend infrastructure from misconfigured or unauthorized clients without pushing additional logic into application code or storage nodes.
Just as importantly, the operational signals are built in. Hit rates, latency distributions, connection churn, and eviction behavior are exposed directly, so teams can understand how their systems behave under load without building custom instrumentation. The goal isn’t to eliminate tradeoffs (they still exist) but to centralize and continuously tune them rather than forcing every organization to rediscover the same failure modes independently.
The routing layer stops being an emergency addition made after scale is reached and instead becomes part of the system’s performance contract. Connection collapse, hot-key protection, and policy enforcement are no longer bolt-ons. They’re architectural properties of the platform itself, designed so backend clusters spend their cycles serving requests instead of managing overhead, and so latency remains predictable even as traffic shape changes.
Many of the ideas in this post were echoed at Unlocked, where engineers operating performance-sensitive systems compared notes on connection pressure, hot-key behavior, and routing strategies in production. If these tradeoffs feel familiar, Unlocked is designed to surface exactly those conversations.